FIGURE SUMMARY
Title

Zbtb16 mediates a switch between Fgf signalling regimes in the developing hindbrain

Authors
Leino, S.A., Constable, S.C.J., Streit, A., Wilkinson, D.G.
Source
Full text @ Development

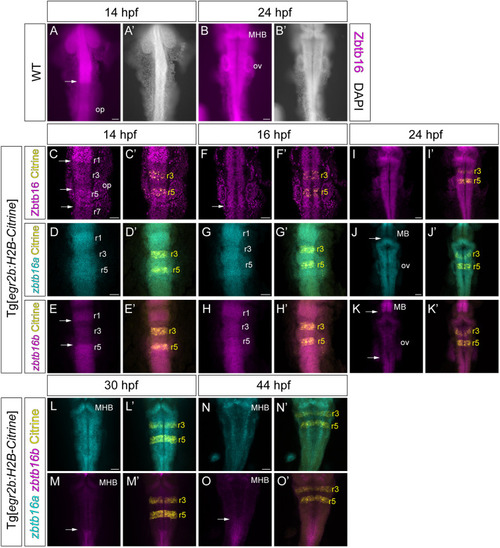
Expression of Zbtb16 protein and zbtb16a/b mRNA in the zebrafish hindbrain. (A,B) Wholemount fluorescence micrographs showing staining with anti-Zbtb16 antibody (see Materials and Methods) at 14 hpf and 24 hpf. (C,F,I) Immunofluorescent staining with anti-Zbtb16 antibody at 14, 16 and 24 hpf. C and F show slices from confocal z-stack, I shows sum projection through z-stack. n≥5 embryos per stage. (D,E,G,H,J-O) HCR for zbtb16a and zbtb16b at 14, 16, 24, 30 and 44 hpf. Sum projections through the z-stack. n≥5 embryos per stage. The Tg[egr2b:H2B-Citrine] line expresses Citrine in rhombomeres (r) 3 and 5. Arrows indicate boundaries between high and low levels of Zbtb16 protein or zbtb16a/b mRNA expression. MB, midbrain; MHB, midbrain-hindbrain boundary; op, otic placode; ov, otic vesicle. Scale bars: 50 µm.

Expression of Zbtb16 during neurogenesis. (A-L) Immunofluorescence for Zbtb16 and HuC/D at 24 and 44 hpf. Dorsal views (A-C,G-I) and transverse sections (D-F,J-L) of the hindbrain. G-I are coronal slices at the level of the mantle zone. Arrows indicate postmitotic neurons (A,B), neurogenic zones (G,H) or Zbtb16+HuC/D double-positive cells (J,L). (M-P) Immunofluorescence for Zbtb16, HuC/D and GFAP at 44 hpf. Side views of the hindbrain, anterior to the left. Arrows indicate Zbtb16-positive migrating progenitors (M) or GFAP-positive glial fibres (O). (Q-V) Two-colour fluorescent ISH for neurog1 and neurod4 (Q-S) or zbtb16a and neurod4 (T-V) at 44 hpf. Side views of the hindbrain, anterior to the left. Arrows indicate overlap of zbtb16a and neurod4 expression. All images are slices from confocal z-stacks. mz, mantle zone; ov, otic vesicle; vz, ventricular zone. Scale bars: 50 µm.

Spatial pattern of neurogenesis in Zbtb16 mutants. (A-F) Colorimetric ISH for neurod4 in 30 hpf sibling control (n=121) and zbtb16a−/− (n=7) embryos (A,B); 30 hpf sibling control (n=18) and zbtb16a−/−;zbtb16b−/− (n=8) embryos (C,D); 44 hpf sibling control (n=8) and zbtb16a−/−;zbtb16b−/− (n=8) embryos (E,F). (G-L,O-T) HCR for etv5b, neurod4 and neurog1 in 30 hpf sibling control (n=16) and zbtb16a−/−;zbtb16b−/− (n=11) embryos (G-L); 44 hpf sibling control (n=9) and zbtb16a−/−;zbtb16b−/− (n=12) embryos (O-T). Sum projections through confocal z-stack. (M,N,U,V) Profile plots of etv5b, neurod4 and neurog1 HCR signal across the hindbrain of representative sibling control (zbtb16a+/+;zbtb16b−/−) and zbtb16a−/−;zbtb16b−/− embryos; anterior to the left. Scale bars: 50 µm.

Spatial analysis of Fgf signalling in Zbtb16 mutants. (A,B) Colorimetric ISH for etv5b in sibling control (A; n=59) and zbtb16a−/−;zbtb16b−/− (B; n=25) embryos. Dorsal views of the hindbrain, wholemount. Arrows indicate rhombomere centres. (C,D) ISH for etv5b in sibling control (C; n=18) and zbtb16a−/− (D; n=6) embryos. (E,F) Sibling control (E; n=88) and zbtb16a−/−;zbtb16b−/− (F; n=28) embryos treated with DMSO from 22 to 24 hpf and stained for etv5b. (G,H) Sibling control (G; n=73) and zbtb16a−/−;zbtb16b−/− (H; n=38) embryos treated with 2.5 µM SU5402 from 22 to 24 hpf and stained for etv5b. Three independent experiments. (I-L′) HCR for etv5b in 24 hpf; sibling control (n=14) and zbtb16a−/−;zbtb16b−/− (n=9) mutant embryos. 3D reconstructions of the z-stack, dorsal view (I,J); confocal z-stack slices (K-L). Arrows in I-L′ indicate the medial wall of the otic vesicle. (M,N) Colorimetric ISH for pax5 in 24 hpf sibling control (n=10) and zbtb16a−/−;zbtb16b−/− (n=11) embryos. (O,P) ISH for pax5 in 36 hpf sibling control (n=29) and zbtb16a−/−;zbtb16b−/− (n=11) embryos. Arrows in M-P show the antero-posterior extent of marker gene expression in the otic vesicle. MHB, midbrain-hindbrain boundary; ov, otic vesicle; r, rhombomere. Scale bars: 50 µm.

Expression of Fgf ligands in Zbtb16 mutants. (A,B) HCR for fgf20a in 24 hpf sibling control (n=26) and zbtb16a−/−;zbtb16b−/− (n=12) embryos. 3D reconstructions of the z-stack, dorsal view. (C,D) Colorimetric ISH for fgf20b in 24 hpf sibling control (n=15) and zbtb16a−/−;zbtb16b−/− (n=4) embryos. Arrows in A-D indicate fgf20-expressing neuronal clusters in rhombomere centres. (E-T) ISH time-course of fgf3 expression in the sibling control (14 hpf: n=19; 16 hpf: n=26; 18 hpf: n=53; 24 hpf: n=47; 30 hpf: n=10; 36 hpf: n=35; 44hpf: n=20; 48 hpf: n=43) and zbtb16a−/−;zbtb16b−/− (14 hpf: n=6; 16 hpf: n=10; 18 hpf: n=20; 24 hpf: n=12; 30 hpf: n=5; 36 hpf: n=13; 44 hpf: n=10; 48 hpf: n=12) hindbrain. Arrows in H indicate ectopic expression in r5/r6, arrow in L indicates ectopic expression in the posterior otic vesicle. MHB, midbrain-hindbrain boundary; r, rhombomere. Scale bars: 50 µm.

Partial rescue of the Zbtb16 mutant phenotype by Fgf3 knockdown. (A-B′) Colorimetric ISH for etv5b in sibling control (n=88) and zbtb16a−/−;zbtb16b−/− (n=40) embryos injected with standard control+p53 MO. (C-D′) ISH for etv5b in sibling control (n=83) and zbtb16a−/−;zbtb16b−/− (n=35) embryos injected with Fgf3 translation blocking MO+p53 MO. Three independent experiments. Dorsal views of the hindbrain, wholemount. r, rhombomere. Scale bars: 50 µm.

Early misexpression of Zbtb16 downregulates fgf3 in rhombomere 4. (A-C) Wholemount fluorescence micrographs of the tailbud of a wild-type embryo injected in one half with mRNA encoding myc-Zbtb16a and stained with anti-Zbtb16 and anti-Myc antibodies. No endogenous Zbtb16 staining is detected at this axial level at 13-14 hpf. (D-F) ISH for fgf3 followed by anti-Myc immunofluorescent staining in wild-type embryos (n=198) injected in one half with mRNA encoding myc-Zbtb16a. (G-I) ISH for fgf3 in wild-type embryos (n=126) injected in one half with mRNA encoding Citrine, showing Citrine fluorescence. Three independent experiments. MHB, midbrain-hindbrain boundary; r, rhombomere. Numbers (D,G; bottom left) indicate numbers of embryos that show dissimilar (D) or similar (G) levels of fgf3 expression in the left and right halves of r4. Scale bars: 50 µm.

Acknowledgments
This image is the copyrighted work of the attributed author or publisher, and ZFIN has permission only to display this image to its users. Additional permissions should be obtained from the applicable author or publisher of the image. Full text @ Development