
- Title
-
Evolutionary conservation of embryonic DNA methylome remodelling in distantly related teleost species
- Authors
- Ross, S.E., Vázquez-Marín, J., Gert, K.R.B., González-Rajal, Á., Dinger, M.E., Pauli, A., Martínez-Morales, J.R., Bogdanovic, O.
- Source
- Full text @ Nucleic Acids Res.

Global DNA methylation levels during medaka embryo development. (A) Global genomic and mitochondrial DNA methylation levels (mCG/CG) in developing medaka embryos. Each point represents the mean of two WGBS biological replicates with error bars indicating the standard error. Stages correspond to: sperm, egg, 32-cell, stage 8 early morula (st.8), stage 9 late morula (st.9), stage 10 early blastula (st.10), stage 11 late blastula (st.11), stage 24—16 somite (st.24) and 4 days post-fertilisation (4dpf). Y-axis is split into 0–0.02 and 0.74–0.9 ranges. (B) Percentage of mitochondrial reads in WGBS datasets. Each point represents the mean of two WGBS replicates with error bars indicating the standard error. (C) Principal component analysis (PCA) of WGBS methylomes corresponding to developing medaka embryos (10kb non-overlapping genomic bins). (D) Correlation between mCG/CG (10kb non-overlapping genomic bins) in st.10 embryos (zygotic genome activation – ZGA), sperm (left) and egg (right). r indicates Pearson correlation values. |

Epigenome remodelling during medaka embryo development. (A) Heatmap of DNA methylation (mCG/CG) levels, ChIP-seq histone modification signal (H3K27me3, H3K4me3, H3K27ac) expressed as RPKM (reads per kilobase per million), ATAC-seq signal (RPKM), and CG density plotted over all developmental DMRs clustered into groups (k-means = 4). Embryonic stages assayed are: 32-cell, stage 8 early morula (st.8), stage 9 late morula (st.9), stage 10 early blastula (st.10), stage 11 late blastula (st.11), stage 24—16 somite (st.24), four days post fertilisation (4dpf), and gametes (sperm, egg). (B) Sub-clustering of cluster-4 DMRs based on mCG/CG levels (k-means = 2). (C) IGV browser snapshots of DNA methylation (mCG/CG) levels (upper panel), histone modification (H3K27me3, H3K4me3, H3K27ac), and ATAC-seq signal (RPKM) at developmental DMRs (blue boxes) during medaka development. Embryo drawings correspond to st.11 (pre-ZGA; upper drawing), and st.24 (16 somites – phylotypic period; lower drawing). Illustrations were adapted with permission from (34). (D) Average profiles of DNA methylation (mCG/CG) during medaka embryo development plotted over H3K27me3 peaks (st.11), ATAC-seq peaks merged from st.11, st.13, st.19, st.25, st.32, H3K4me3 peaks merged from st.11, st.24) and all H3K27ac peaks identified at st.11 and st.24 that do not overlap H3K4me3 peaks. Dotted lines represent sperm and pre-ZGA/ZGA samples whereas full lines denote egg and other embryonic stages. |
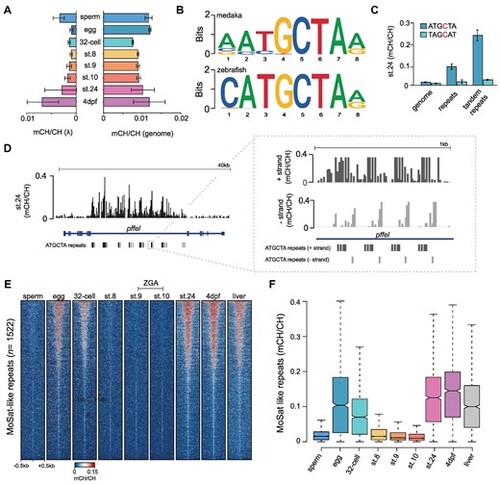
CH methylation dynamics during medaka embryo development. (A) Global CH methylation levels (mCH/CH) in the medaka genome and in spike-in lambda (λ) controls during embryonic development. Data is represented as the mean of two WGBS biological replicates with error bars indicating the standard error. (B) The topmost enriched motif from 10000 most methylated CH sites in st.24 medaka embryos and 24hpf zebrafish embryos. (C) CH methylation levels (mCH/CH) at ATGCTA and its complement TAGCAT nucleotides in the genome, repeat elements, and tandem repeat elements in st.24 medaka embryos. Data is represented as the mean of two WGBS biological replicates with error bars indicating the standard error. (D) IGV browser snapshot of mCH/CH levels at ATGCTA repeats in st.24 medaka embryos with the right panel displaying a zoomed-in view of mCH/CH levels in a strand-specific manner. (E) Heatmap of CH methylation levels (mCH/CH) at ATGCTA-containing tandem repeats (MoSat-like repeats), in developing medaka embryos. (F) Distribution of CH methylation (mCH/CH) levels at ATGCTA containing tandem repeats (MoSat-like repeats) in developing medaka embryos. The boxplots show the median (centre line) and the first and third quartiles (Q1 and Q3; box limits), and the whiskers extend to the last point within 1.5X of the interquartile range below and above Q1 and Q3, respectively. |
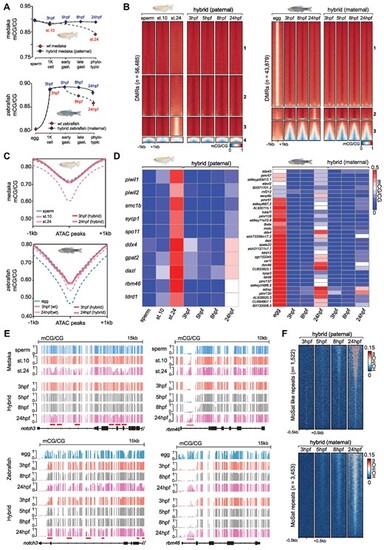
DNA methylation dynamics during medaka-zebrafish hybrid embryo development. (A) Global mCG/CG levels of the paternal medaka methylome (top) and maternal zebrafish methylome (bottom) in medaka-zebrafish hybrids compared to the closest relative stage in wt zebrafish and medaka. Data is represented as the mean of two biological WGBS replicates with error bars indicating the standard error. (B) Heatmap of mCG/CG levels at developmental DMRs in medaka and the paternal hybrid methylome (left), and zebrafish and the maternal hybrid methylome (right). (C) mCG/CG plotted over developmental ATAC-seq peaks in the paternal medaka methylome (top) and maternal zebrafish methylome (bottom) from medaka-zebrafish hybrids. (D) Heatmap of mCG/CG levels at evolutionarily conserved CTA promoters in medaka and the paternal hybrid methylome (left), and zebrafish and the maternal hybrid methylome (right). Data is represented as the mean of two WGBS biological replicates. (E) IGV browser snapshot of mCG/CG levels during medaka, zebrafish, and medaka-zebrafish hybrid development. Red line = examples of developmental enhancers which normally undergo developmental hypomethylation. Purple line = examples of CTA promoter regions which normally undergo developmental hypermethylation. (F) Heatmap of mCH/CH levels at MoSat-like TGCT-containing tandem repeats in the paternal medaka hybrid methylome (left) and mCH/CH levels at MoSat repeats in the maternal zebrafish hybrid methylome (right). |

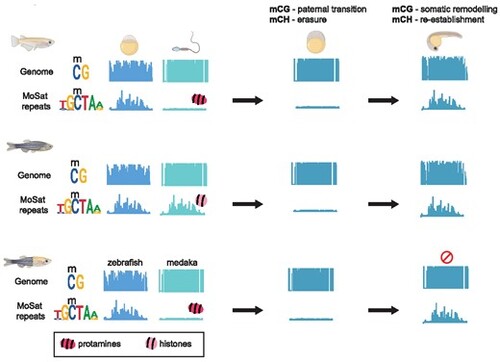
Overview of DNA methylation dynamics during teleost embryogenesis. (A) mCG dynamics in medaka, zebrafish, and medaka-zebrafish hybrids at the whole genome level (genome browser snapshots), hox clusters (HOX), Cancer Testis Antigen promoters (CTA), and phylotypic enhancers (PHYLO) in gametes, ZGA blastula embryos, and during the phylotypic period. Early teleost embryogenesis, as observed in medaka, zebrafish, and medaka-zebrafish hybrids, is characterised by maternal adoption of a paternal-like mCG methylome state prior to ZGA onset. Organogenesis stages (phylotypic period) are characterised by CTA promoter hypermethylation (hypermC), and phylotypic (organogenesis) enhancer demethylation (hypomC). Both processes, while highly conserved between medaka and zebrafish, are not carried out to the same extent in medaka-zebrafish hybrid embryos. (B) mCH dynamics at TGCT tandem repeats in medaka, zebrafish, and medaka-zebrafish hybrid embryos in gametes, ZGA blastula embryos, and during the phylotypic period. TGCT methylation is present in both maternal and paternal zebrafish germline genomes, whereas in medaka and medaka-zebrafish hybrid embryos this type of methylation can be found only in the maternal genome. Notably, zebrafish and medaka differ in their sperm packaging mechanisms with zebrafish employing histones, and medaka protamines, to package their sperm. |
|