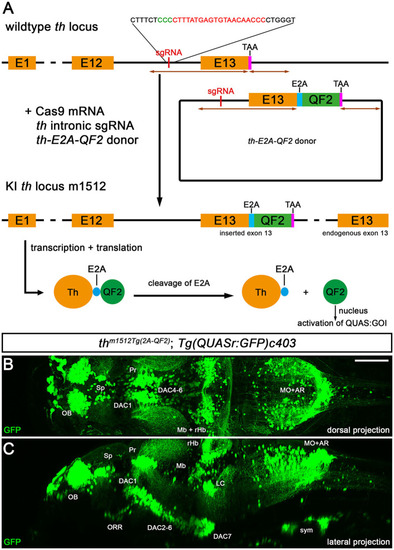
Knock-in of QF2 into the th locus. (A) Schematic of the knock-in strategy used for the generation of thTg(2AQF2), which is based on a previously published strategy (Li et al., 2015). Successful knock-in leads to an in-frame fusion of Th with E2A-QF2, which is cleaved after translation, releasing QF2. QF2 translocates to the nucleus and activates a gene of interest (GOI) downstream of a QUAS regulatory element. (B) Maximum intensity projection of a 2-photon confocal image stack of an in vivo recorded thm1512Tg(2AQF2); Tg(QUASr:GFP)c403 larva at 5 dpf in a dorsal view. (C) Maximum intensity projection of the embryo shown in (B) in a sagittal resliced view. Anterior is to the left. Scale bar: 100 μm. Due to very strong intensity differences in cytoplasmic GFP fluorescence of somata vs. axons, and in order to visualize both somata and projections, we needed to record under conditions that oversaturate pixels in many somata. AR, area postrema; DAC, dopaminergic cluster; LC, locus coeruleus; Mb, midbrain; MHB, midbrain–hindbrain boundary; MO, medulla oblongata; OB, olfactory bulb; ORR, optic recess region; Pr, pretectum; rHb, rostral hindbrain; Sp, subpallium; sym, sympathetic neurons.

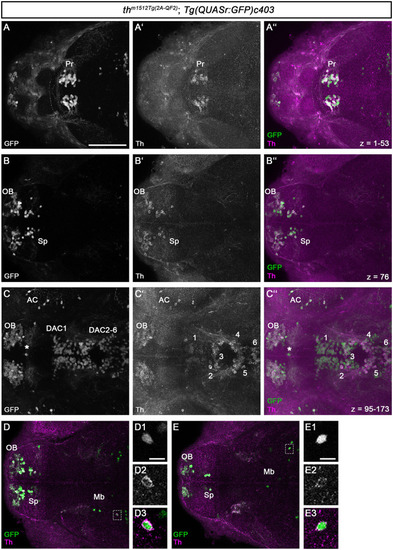
QF2-driven GFP expression highly coincides with endogenous Th. (A–C”) Immunofluorescence staining for GFP (green) and Th (magenta) of a thm1512Tg(2AQF2); Tg(QUASr:GFP)c403 embryo at 96 hpf. Dorsal views of z-projections (A–A”, C–C”) or single focal planes (B–B”). Anterior is to the left. (A–C”) The expression of GFP and Th coincides in the pretectum (A–A”), telencephalon (B–B”), prethalamus, and hypothalamus (C–C”). The total z-stack volume of 198 focal planes and z-step of 1 μm with focal plane 1 being the most dorsal and focal plane 198 the most ventral. (A)z-projection from focal plane 1–53. (B) Confocal plane 76 (C)z-projection from focal plane 95–173. The asterisk in (C–C”) marks a GFP but not Th-immunoreactive cell at the telencephalic midline ventricular wall. (D, E) Immunofluorescence staining for GFP (green) and Th (magenta) of a thm1512Tg(2AQF2); Tg(QUASr:GFP)c403 embryo at 96 hpf with focus on GFP+ cells located in the midbrain (dashed boxes). Dorsal views of single focal planes. (D1–D3) Magnification of the marked cell in (D). (E1–E3) Magnification of the marked cell in (E). Scale bars: (A–C”, D, E) 100 μm; (D1, E1) 10 μm. For better representation of low and high signal intensities, non-linear adjustments were made to whole image panels (see Section 2.8). AC, amacrine cells; DAC1-6, dopaminergic cluster 1-6; Mb, midbrain; OB, olfactory bulb; Pr, pretectum; Sp, subpallium.

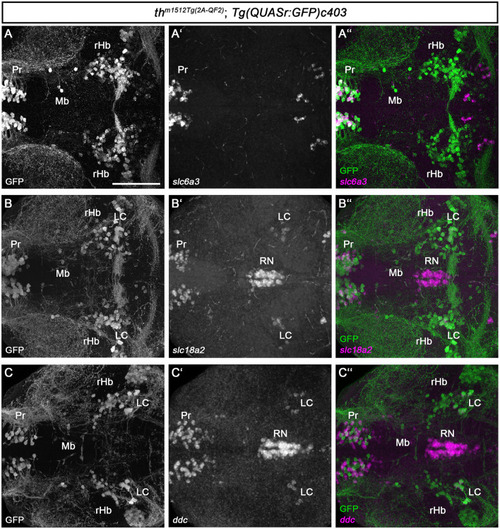
Midbrain and rHb GFP+ cells do not express other monoaminergic/catecholaminergic markers. (A–C”) Whole brain fluorescent in situ hybridization for the indicated mRNAs (magenta) and immunofluorescence staining for GFP (green) in thm1512Tg(2AQF2); Tg(QUASr:GFP)c403 larval brains at 120 hpf. Dorsal views of z-projections. Anterior is to the left. (A–A”) Expression of the dopaminergic marker slc6a3 in comparison with GFP expression in the pretectum, midbrain, and hindbrain. (B–B”) Expression of the monoaminergic marker slc18a2 in comparison with GFP expression in the pretectum, midbrain, and hindbrain. (C–C”) Expression of the catecholaminergic marker ddc in comparison with GFP expression in the pretectum, midbrain, and hindbrain. Scale bar: 100 μm. For better representation of low and high signal intensities, non-linear adjustments were made to whole image panels (see Section 2.8). LC, locus coeruleus; MHB, midbrain–hindbrain boundary; Mb, midbrain; Pr, pretectum; rHb, rostral hindbrain; RN, raphe nucleus.

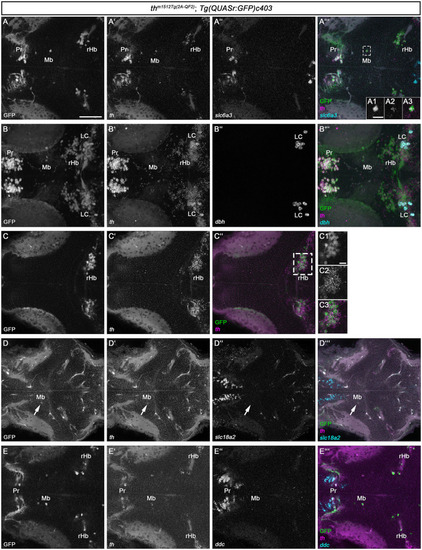
HCR RNA-FISH does not reveal coexpression of catecholaminergic markers except th in GFP+ cells in the midbrain and rostral hindbrain. (A–E”') Whole mount HCR RNA-FISH for th (magenta), slc6a3 (cyan), dbh (cyan), slc18a2 (cyan), and ddc (cyan) in comparison with GFP in thm1512Tg(2AQF2); Tg(QUASr:GFP)c403 larvae at 120 hpf. Dorsal views of z-projections (B–B”') or single planes (A–A”', A1–A3, C–C”, D–E”'). Anterior is to the left. (A–A”') Expression of th and slc6a3 in comparison with GFP in the pretectum, midbrain, and hindbrain. The dashed box indicates GFP+ cells in the midbrain. (A1–A3) Magnification of the cell marked by the dashed box showing GFP in comparison with th expression. (B–B”') Expression of th and dbh in comparison with GFP in the pretectum, midbrain, and rostral hindbrain. (C–C”) Comparison of GFP with th expression in the rostral hindbrain close to the midbrain–hindbrain boundary, more dorsally than (A–A”'). (C1–C3) Magnification of rHb cells marked by a dashed box in (C”). (D–D”') Expression of th and slc18a2 in comparison with GFP expression in the midbrain. (E–E”') Comparison of GFP expression with th and ddc in the pretectum, midbrain, and rostral hindbrain close to the midbrain–hindbrain boundary. Scale bars: (A) 50 μm; (A1) 10 μm; (C1) 10 μm. For better representation of low and high signal intensities, non-linear adjustments were made to whole image panels (see Section 2.8). LC, locus coeruleus; Mb, midbrain; MHB, midbrain–hindbrain boundary; Pr, pretectum; rHb, rostral hindbrain.

Th/th+ neurons reside in the tegmental midbrain and the rostral hindbrain. (A–F”, F1–F3) Whole-brain fluorescent in situ hybridization and immunofluorescence staining for the indicated mRNAs (magenta) and GFP (green) in thm1512Tg(2AQF2); Tg(QUASr:GFP)c403 larval brains at 120 hpf. Dorsal views of z-projections (B') or single planes (A, B, C–F”, F1-F3). Anterior is to the left. (A, B) Expression of the midbrain–hindbrain boundary marker pax2a in comparison with GFP in a dorsal view (A) and a more ventral view (B). The dashed box indicates GFP+ cells in the midbrain. (B') z-projection (z-stack size: 31 μm) and magnification of the cells marked by a dashed box in (B). (C) Expression of the midbrain–hindbrain boundary marker en1a/en2a in comparison with GFP. (D, E) Expression of the mammalian midbrain dopaminergic marker pitx3 in comparison with GFP, focusing on GFP+ cells in the midbrain (D) and a more ventral view (E). (F–F”) Expression of the mammalian mDA and tegmental marker nr4a2a/nr4a2b in comparison with GFP. The dashed box in (F”) indicates GFP+ cells in the midbrain. (F1–F3) Magnification of the cells marked by a dashed box in (F”). Scale bars: [(A), also for (B, C–F”)] 100 μm; (B') 20 μm; (F1–F3) 10 μm. For better representation of low and high signal intensities, non-linear adjustments were made to whole image panels (see Section 2.8). LC, locus coeruleus; Mb, midbrain; MHB, midbrain–hindbrain boundary; Pr, pretectum; rHb, rostral hindbrain; Teg, tegmentum.

Acknowledgments
This image is the copyrighted work of the attributed author or publisher, and ZFIN has permission only to display this image to its users. Additional permissions should be obtained from the applicable author or publisher of the image. Full text @ Front. Neuroanat.