
- Title
-
Fluorescent PCR-based Screening Methods for Precise Knock-in of Small DNA Fragments and Point Mutations in Zebrafish
- Authors
- Carrington, B., Sood, R.
- Source
- Full text @ Bio Protoc

Screenshot of the UCSC Genome Browser with CRISPRscan and ZebrafishGenomics hubs enabled to identify sgRNA target sites. Use tracks (marked in yellow) to search for targets that can be synthesized with a T7 promoter (guide sequence begins with a “GG”) as close as possible to the intended nucleotide for point mutation or site of insertion. In this example, both CRISPRscan and ZebrafishGenomics predicted two overlapping targets (sgRNA-T1 and sgRNA-T2) close to the target nucleotide (marked in red box) and were selected for sgRNA synthesis. |

Agarose gel electrophoresis showing products of oligo assembly and sgRNA synthesis reactions. Lane M: marker (50 bp ladder); lane 1: correctly assembled oligo runs at ~120 bp; lane 2: successful sgRNA synthesis product runs between 100 and 200 bp. |

Examples of CRISPR-STAT plots showing sgRNA activity. In this example, both sgRNAs selected in Figure 1 are active. sgRNA-T1 would be selected as the best target and used in subsequent steps, as it generates the DSB closer to the intended nucleotide change. The x-axis shows the size of the peaks (bp), the y-axis shows fluorescent intensity, and the green arrow denotes the WT allele. |

Examples of HDR template design to knock-in desired DNA sequences. (A) The DNA insertion of an in-frame codon TTA occurs directly at the DSB (denoted by red arrowhead). This insertion disrupts the sgRNA binding site and no additional modifications are required. (B) The DNA insertions occur 5 bp upstream of the DSB (denoted by red arrowhead). The insertion does not disrupt the sgRNA binding or the PAM site and a silent change cannot be made to the PAM site. Therefore, several silent changes (shown in magenta) are required to prevent recutting after HDR repair. (C) The HA epitope tag is inserted at the 3′ end of a gene’s ORF. The DSB (denoted by red arrowhead) occurs 6 bp upstream of the stop codon (shown in red font). To maintain the gene’s ORF, these 6 bp (shown in blue font) are added into the HDR template with one of the nucleotides (shown in magenta font) changed to a silent change to modify PAM site and prevent recutting after HDR repair. A new stop codon (shown in purple font) is added after the HA tag to terminate translation. In all examples, the sgRNA is in bold and the PAM site is underlined |

Examples of HDR template design to knock-in a point mutation. (A) The point mutation G>A (shown in blue font) modifies the PAM site as well as generates an AluI restriction site that can be used for screening. (B) The point mutation G>C (shown in blue font) is 17 bp downstream of the DSB site. A silent change is made to disrupt the PAM site (G>C, shown in magenta font) and this change also generates a SalI restriction site that can be used for screening. (C) The point mutation C>A (shown in blue font) is 6 bp upstream of the DSB site. In this example, a silent change cannot be made to the PAM site, and, therefore, four silent changes are required (shown in magenta font) to destroy the sgRNA binding site. One of these changes also generates a SfcI restriction site that can be used for screening. In all examples, the DSB site is denoted by a red arrowhead, sgRNA is shown in bold font, and the PAM site is underlined. |

Schematic showing design of screening primers for insertion of a DNA fragment. Primers should not overlap with the HDR template to allow for screening of precise integration. Homology arms (left HA and right HA) are marked in red in both genomic DNA and HDR template. Inserted sequence is marked in blue on the HDR template. M13F sequence is added to the forward primer and the PIG-tail sequence is added to the reverse primer. |
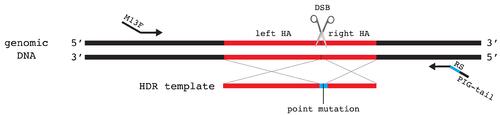
Schematic showing design of screening primers for knock-in of a point mutation. Primers should not overlap with the HDR template (shown with homology arms in red, restriction enzyme recognition sequence in blue, and point mutation by black line) to allow for screening of precise integration. M13F sequence is added to the 5′ end of forward primer. PIG-tail and the restriction enzyme recognition sequences (RS) are added to the 5′ end of reverse primer. |

Examples of CRISPR-STAT plots from injected embryos to detect somatic knock-in. CRISPR-STAT plots from uninjected, sgRNA/Cas9-injected, and sgRNA/Cas9 plus HDR template–injected embryos are analyzed to determine if an enrichment of the peak corresponding to the knock-in allele size is seen in the presence of HDR template. The x-axis shows the size of the peaks (bp), the y-axis shows fluorescent intensity, and the red arrow denotes the expected knock-in allele. (A) Example of a DNA insertion with the knock-in peak being larger than the WT allele. (B) Example of a point mutation before and after digestion. The undigested samples serve as controls, with peak for WT allele at 7–10 bp larger than in the digested samples. The peak for knock-in allele should only be observed after digestion in sgRNA/Cas9 plus HDR template samples. |

Examples of fluorescent PCR plots from pooled embryo screening to identify germline transmitting founders. Each embryo has a WT allele from the WT parent and an unknown allele (could be WT, indel, or knock-in) from the founder fish. Thus, a robust WT peak (denoted by green arrow) is detected in all pools with up to three additional peaks of unknown sizes. (A) Example of a positive pool with one embryo heterozygous for the knock-in allele (denoted by red arrow). Other peaks in this sample (denoted by the blue arrows) are random indels generated by NHEJ. (B) Example of a negative sample where all embryos are heterozygous for random indels (denoted by blue arrows). The x-axis shows the size of the peaks (bp), and the y-axis shows fluorescent intensity. |