FIGURE SUMMARY
Title

Disentangling the link between zebrafish diet, gut microbiome succession, and Mycobacterium chelonae infection

Authors
Sieler, M.J., Al-Samarrie, C.E., Kasschau, K.D., Varga, Z.M., Kent, M.L., Sharpton, T.J.
Source
Full text @ Anim Microbiome

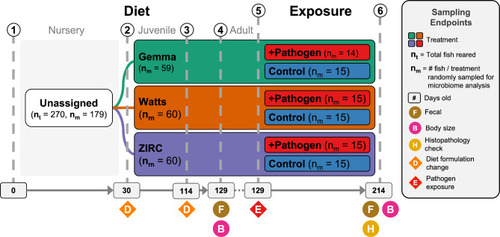
Experimental design showing treatments and husbandry events during the course of the study. Symbols indicate when an event occurred. (1) 270 fish were reared from 0 to 30 days post fertilization (dpf) on a nursery diet across 18 tanks (15 fish per tank). (2) At 30 dpf, fish were assigned one of three diets (e.g., Gemma, Watts, or ZIRC), and fed a juvenile formulation until 114 dpf. (3) At 114 dpf, fish were switched to an adult formulation of their respective diets. (4) At 129 dpf, body size measurements were conducted on all fish and fecal samples were collected from a random selection of five fish per tank (n = 90). (5) Afterwards, a cohort of fish from each diet were exposed to Mycobacterium chelonae. (6) Three months later when fish were 214 dpf, body size measurements were conducted on all fish and fecal samples were collected from a random selection of five fish per tank (n = 89). Histopathology check was conducted to assess infection burden on all fish

Effects of 129 days post fertilization (dpf) fish fed one of three diets (Gemma, Watts, or ZIRC) on physiology and microbiomes of zebrafish. (A) Weight of ZIRC-diet fed fish significantly differs from Watts- and Gemma-diet fed fish. Gemma- and Watts-diet fed fish do not differ from each other. (B) Body condition score is a length normalized measure of weight. Fish fed the ZIRC diet have significantly higher body condition scores from fish fed the Gemma and Watts diets. (C) Shannon Entropy of diversity shows that gut microbiome diversity significantly differs between Gemma- and Watts-diet fed fish, ZIRC- and Watts-diet fed fish, but not between Gemma- and ZIRC-diet fed fish. (D) Capscale ordination based on the Bray-Curtis dissimilarity of gut microbiome composition. The analysis shows that physiology and gut microbiome composition significantly differs between the diets. “ns” indicates not significantly different, *, **, *** indicates significant differences below the 0.05, 0.01, and 0.001 levels, respectively

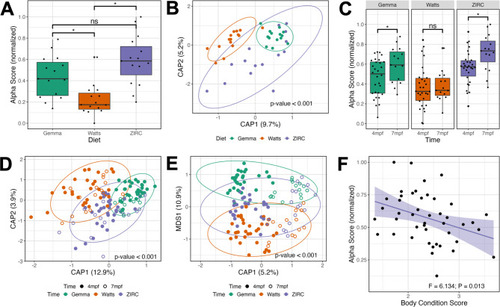
Development is associated with altered microbiome composition. (A) Shannon Entropy of diversity shows that gut microbiome diversity significantly differs between Watts-diet fed fish to fish fed the Gemma- and ZIRC-diets in 214 days post fertilization (dpf) zebrafish. (B) Capscale ordination based on the Bray-Curtis dissimilarity of gut microbiome composition in 214 dpf zebrafish. (C) Shannon Entropy for diversity shows microbial gut diversity increases with development in 129- to 214 dpf zebrafish fed the Gemma- and ZIRC-diets, but not Watts-diet fed fish. Capscale ordination of gut microbiome composition based on the (D) Bray-Curtis dissimilarity by diet and (E) Canberra measure by time. (F) Body condition score negatively associates with gut microbiome diversity as measured by Simpson’s Index across 129- and 214 dpf zebrafish fed the ZIRC diet. The analysis shows that fish size and gut microbiome composition significantly differs between the diets across development, and there may be diet-dependent link with physiology. A “ns” indicates not significantly different, “*” indicates significant differences below the 0.05 level

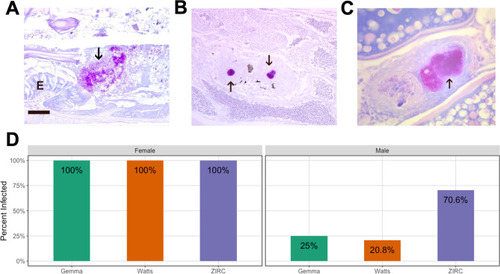
Histologic sections stained with Kinyon’s acid fast stain in zebrafish exposed to Mycobacterium Chelonae examined at 15 week post exposure. Arrow = acid fast bacteria. (A) Bacteria in intestinal lumen (E = intestinal epithelium, Bar = 25 μm). (B) Testis with two granulomas with acid fast bacteria. (C) Ovary with two granulomas, one containing abundant acid fast bacteria. (D) Infection outcome analysis of male and female fish injected with M. chelonae (n = 66). All exposed female fish were positive for infections, but male fish differed in infection outcomes depending on diet

Exposure to Mycobacterium chelonae inhibits diversification of gut microbiome. (A) Shannon Index for diversity of pre-exposed 129 days post fertilization (dpf), 214 dpf exposed and unexposed fish, and (B) for exposure groups within each diet. Capscale ordination based on the Bray-Curtis dissimilarity of gut microbiome composition of fish by (C) diet. (D) Log fold change of Mycobacterium of pre-exposed, exposed and unexposed fish within each diet as calculated by ANCOM-BC. Values are in reference to exposed fish within each diet. The analysis shows gut microbiome’s sensitivity to pathogen exposure is linked to diet, but Mycobacterium’s abundance is diet-dependent. A “ns” indicates not significantly different, and * indicates significant differences below the 0.05. An “X” indicates a group is significantly differentially abundant compared to the exposed treatment reference group

Acknowledgments
This image is the copyrighted work of the attributed author or publisher, and ZFIN has permission only to display this image to its users. Additional permissions should be obtained from the applicable author or publisher of the image. Full text @ Anim Microbiome