FIGURE SUMMARY
Title

Mutation of brain aromatase disrupts spawning behavior and reproductive health in female zebrafish

Authors
Shaw, K., Therrien, M., Lu, C., Liu, X., Trudeau, V.L.
Source
Full text @ Front Endocrinol (Lausanne)

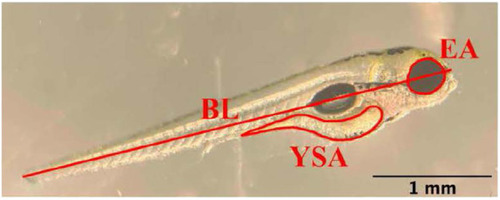
Depiction of the measurement of body length (BL), eye area (EA), and yolk sac area (YSA) in an eleutheroembryo on day 2 post-fertilization. Scale bar = 1 mm.

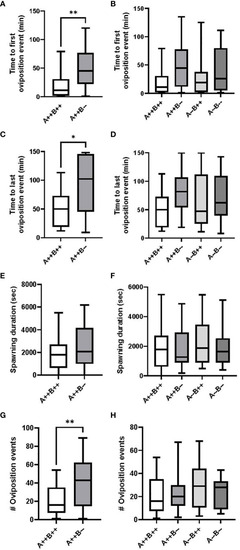
Timing and number of oviposition events during zebrafish pairwise mating trials. Test females (n=17 pairs) are displayed on the left (A, C, E, G) and test males (n=17-18 pairs) are displayed on the right (B, D, F, H). Mann-Whitney U (A, C, G), Student’s T (E), Kruskal-Wallis (B) and One-Way ANOVA (D, F, H) tests were performed. Horizontal lines represent mean or median values, boxes represent interquartile ranges, and whiskers represent min-max values. Key to genotypes: A=cyp19a1a, B=cyp19a1b. Asterisks denote p<0.05 (*) and p<0.01 (**).

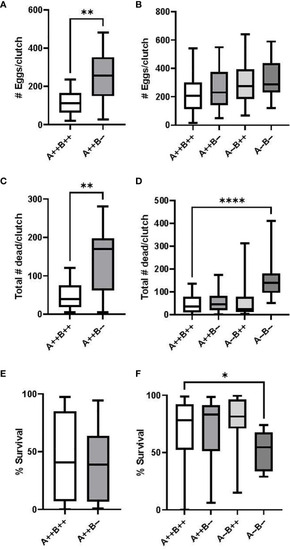
Number of eggs spawned per clutch and egg survival rate during zebrafish pairwise mating trials. Test females (n=14-16 pairs) are displayed on the left (A, C, E) and test males (n=16-23 pairs) are displayed on the right (B, D, F). Mann-Whitney U (A, C), Student’s T (E), One-Way ANOVA (B) and Kruskal Wallis (D, F) tests were performed. Horizontal lines represent mean or median values, boxes represent interquartile ranges, and whiskers represent min-max values. Key to genotypes: A=cyp19a1a, B=cyp19a1b. Asterisks denote p<0.05 (*), p<0.01 (**), p<0.0001 (****).

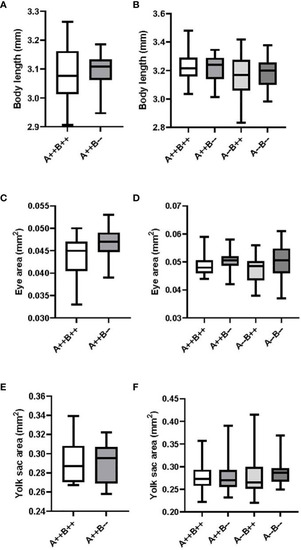
Body length, eye area, and yolk sac area measurements of eleutheroembryos from zebrafish pairwise mating trials on day 2 post-fertilization. Eleutheroembryos from test females (n=9-14) are displayed on the left (A, C, E) and from test males (n=16-21 pairs) are displayed on the right (B, D, F). Student’s T (A, C, E), One-Way ANOVA (B) and Kruskal-Wallis (D, F) tests were performed. Horizontal lines represent mean or median values, boxes represent interquartile ranges, and whiskers represent min-max values. No statistical differences between genotypes were evident. Key to genotypes: A=cyp19a1a, B=cyp19a1b.

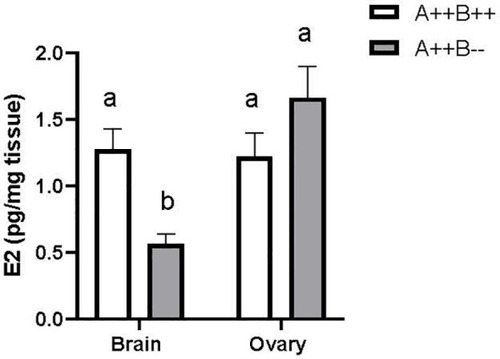
Estradiol (E2) levels in the brains and ovaries of adult WT (A++B++) and cyp19a1b-/- (A++B–) female zebrafish (n=5-8 per group). Data were log-transformed and analyzed using a Two-Way ANOVA followed by Tukey’s multiple comparisons tests. Data are plotted as means + SEM. Means with different letters a-b represent statistically significant differences (p<0.05). For clarity, the significant main effect of tissue type is not displayed. Key to genotypes: A=cyp19a1a, B=cyp19a1b.

Acknowledgments
This image is the copyrighted work of the attributed author or publisher, and ZFIN has permission only to display this image to its users. Additional permissions should be obtained from the applicable author or publisher of the image. Full text @ Front Endocrinol (Lausanne)