
- Title
-
Unbiased characterization of the larval zebrafish enteric nervous system at a single cell transcriptomic level
- Authors
- Kuil, L.E., Kakiailatu, N.J.M., Windster, J.D., Bindels, E., Zink, J.T.M., van der Zee, G., Hofstra, R.M.W., Shepherd, I.T., Melotte, V., Alves, M.M.
- Source
- Full text @ iScience
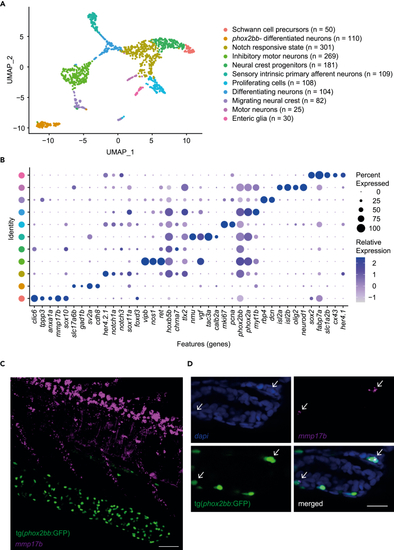
Single cell transcriptomics of 5 dpf zebrafish ENS (A) UMAP of 1369 ENS cells, containing eleven different clusters. (B) Dot plot showing expression of genes highly differentially expressed between clusters. (C) Maximum projection from FISH recordings of 5 dpf tg( (D) Single plane detailed images of FISH of 5 dpf tg( |
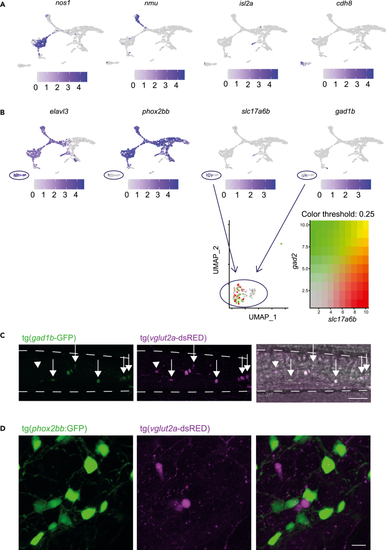
The 5 dpf intestine contains four clusters of differentiated neurons including a cluster of elavl3+; phox2bb-enteric neurons showing excitatory and inhibitory gene expression (A) Featureplots of genes defining four clusters of differentiated neurons. (B) Featureplots highlighting the presence of a cluster of cells expressing (C) Maximum projections of live imaging recordings from 7 dpf tg( (D) Maximum projections of live imaging recordings from 7 dpf tg( |
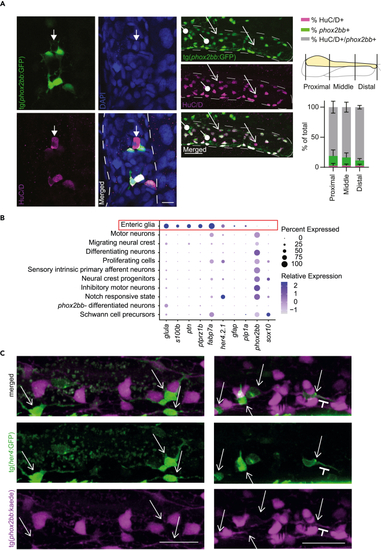
One small cluster expresses genes typical for enteric glia in mammalians (A) Left: Single plane recording showing a HuC/D+phox2bb-neuron. Scale bar represents 10 μm. Right: Maximum projections of HuC/D antibody staining shows that most HuC/D+ cells in the intestine express phox2bb, but also show phox2bb+/HuC/D-cells (progenitors) depicted by the arrows with a circle end, and phox2bb-;HuC/D+ cells (differentiated neurons) depicted by arrows. Scale bar represents 40 μm. Quantification of the relative amount of double and single positive cells, relative to the total number of enteric neurons (HuC/D only, phox2bb only and double-positives combined)(n=9; 5 dpf, error bars show standard deviation). (B) Dotplot showing selective expression of some known enteric glia and radial glia markers and lack of expression of (C) Maximum projections of live-imaging recordings of 5 dpf photoconverted tg(8.3 |
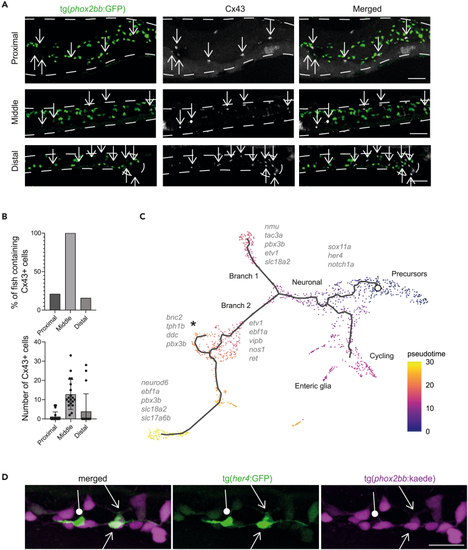
Pseudotime analysis shows differentiation trajectories from right to left of the UMAP (A) Immunohistochemistry staining of Cx43 in the tg( (B) Upper graph shows the percentage of larvae that contained Cx43 cells in their proximal, middle and distal intestine. The lower graph shows the number of Cx43 cells per larvae in the proximal, middle and distal intestine (n = 19, error bars show standard deviation). (C) Pseudotime color-coded featureplot showing a bifurcation toward neuronal differentiation (sensory IPAN: branch1 and inhibitory motor neurons: branch2 containing a secondary branch toward serotonergic neurons marked with an asterix). (D) Maximum projections of live-imaging 5 dpf tg(8.3 |