
- Title
-
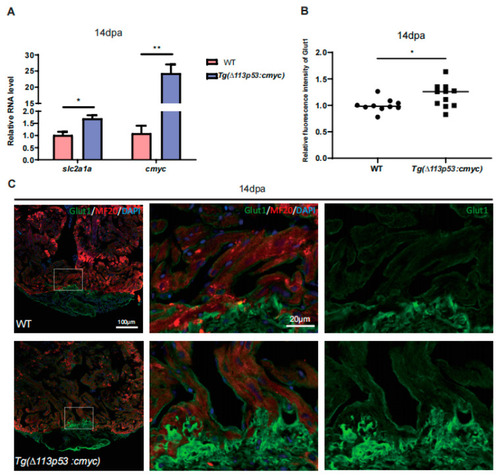
Tg(Δ113p53:cmyc) Transgene Upregulates glut1 Expression to Promote Zebrafish Heart Regeneration
- Authors
- Tang, Z., Wang, K., Lo, L., Chen, J.
- Source
- Full text @ J Cardiovasc Dev Dis
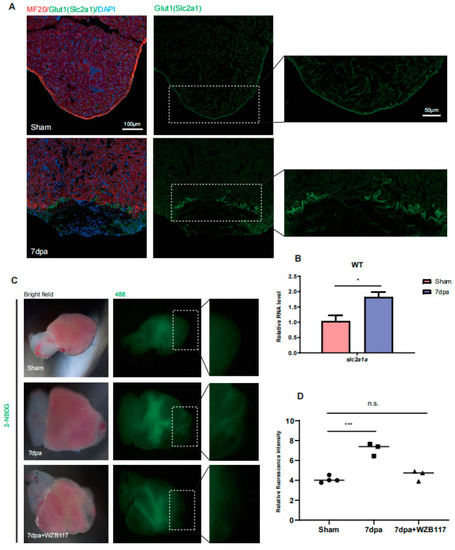
Glut1 expression and glucose uptake are upregulated around injury area of zebrafish hearts. ( |
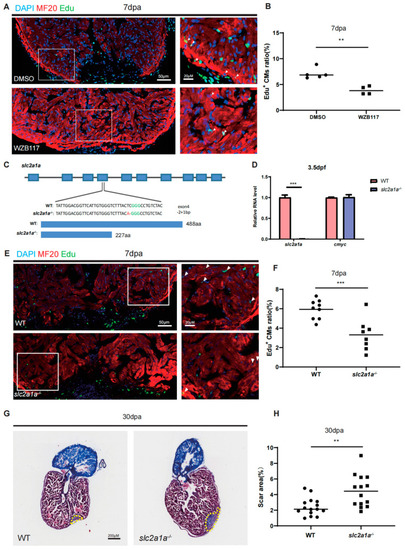
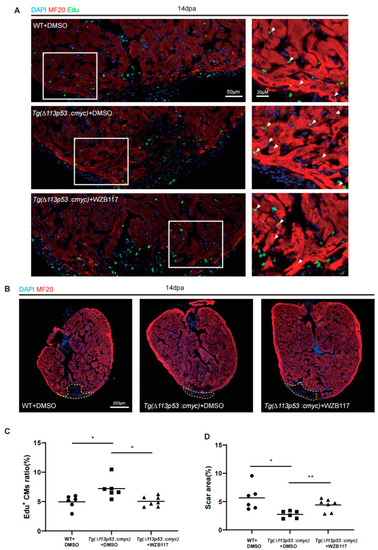
Depletion of Glut1 impairs zebrafish heart regeneration. ( |
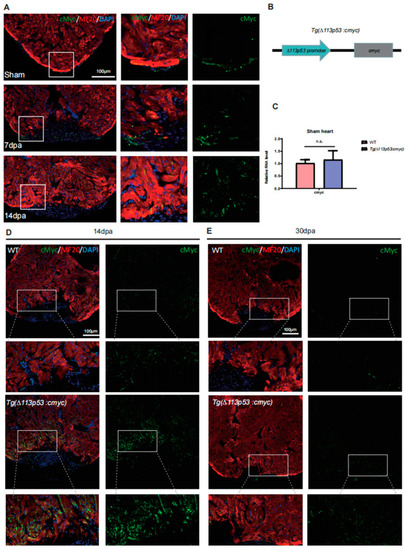
The expression of cMyc is activated around the injury site of zebrafish hearts, which is excessively upregulated in |
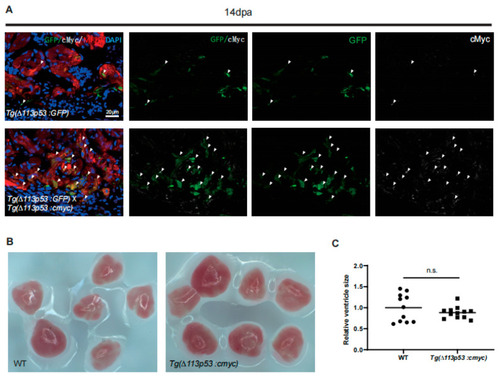
cMyc is conditionally overexpressed in |
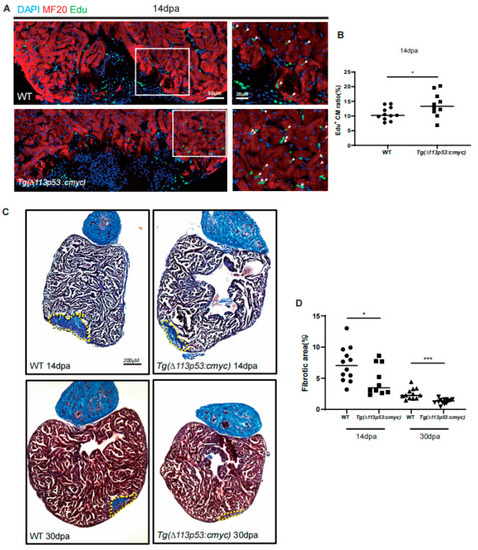
Conditional overexpression of |
Conditional overexpression of |
Conditional overexpression of |