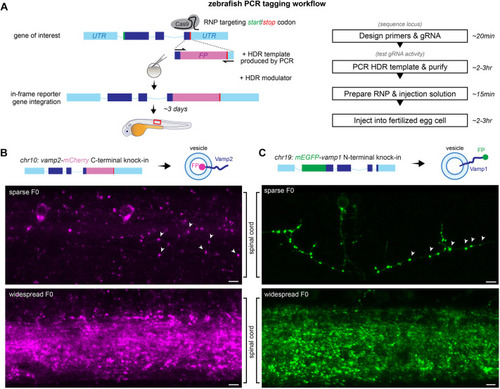
PCR tagging in zebrafish. (A) PCR tagging workflow: a gRNA/Cas9 RNP targeting the start or stop codon of a gene of interest is co-injected with a PCR-generated HDR template with short homology arms into fertilized zebrafish eggs, leading to integration of a fluorescent protein (FP) coding sequence. UTR, untranslated region. Red box indicates field of view in B,C and throughout the figures. (B,C) Lateral view of spinal cords of 3-5 dpf vamp2-mCherry and mEGFP-vamp1 PCR-tagged zebrafish showing vesicular fluorescence in synaptic boutons (arrowheads). Scale bars: 5 µm.
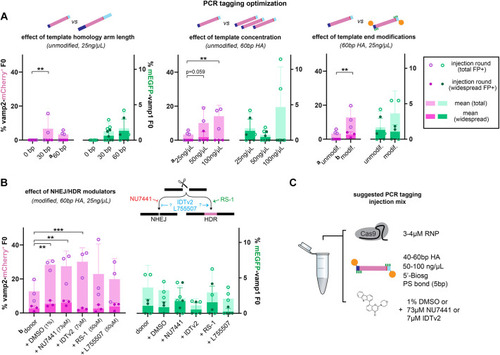
Optimization of PCR tagging injection mix. (A,B) Optimization of homology arm (HA) length, template concentration and end modification (A) and small molecule modulation of NHEJ/HDR pathways (B). Efficiency is expressed as percentage of F0 larvae that are mCherry+ or mEGFP+ at 3-5 dpf. Circles indicate individual injection rounds and bars indicate the mean of 3-5 injection rounds per condition. The number of surviving larvae analyzed per injection round varied between 9 and 253 (88 on average, for full details see Table S2). Error bars indicate standard deviation. *P<0.05, **P<0.01, ***P<0.001 (two-way ANOVA corrected for multiple comparisons). For ease of comparison, data indicated by superscript a and b are shown in more than one graph. (C) Suggested components of injection mix for PCR tagging in zebrafish. Biosg, standard biotin modification; PS, phosphorothioate bond.
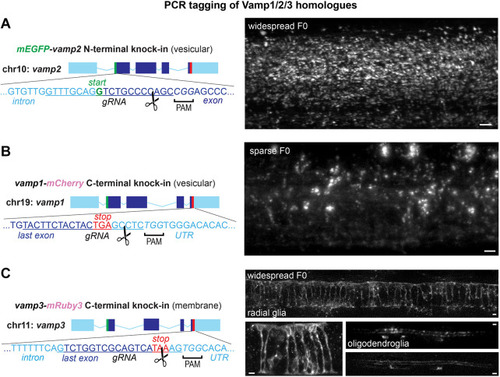
PCR tagging of related homologues Vamp1, Vamp2 and Vamp3. (A-C). Targeting additional vamp2 (N-terminal, A), vamp1 (C-terminal, B) and vamp3 (C-terminal, C) genomic loci. Representative widespread and sparse F0 larvae show vesicular mEGFP-Vamp2 and Vamp1-mCherry throughout the spinal cord and a membrane-like expression pattern of Vamp3-mRuby3 in radial and myelinating glial cells in the spinal cord. Scissors indicate predicted RNP cleavage site. Scale bars: 5 µm.
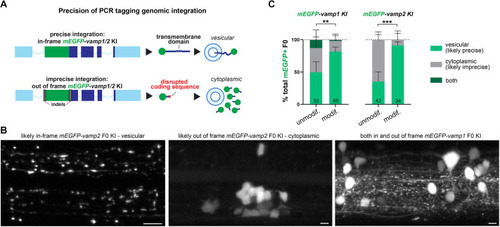
N-terminal Vamp1/2 knock-in reveals precision level of PCR tagging. (A,B) N-terminal tagging allows detection of imprecise integration e.g. when indels knock the vamp1/2 coding sequences out of frame, disrupting vesicular localization signals and leading to cytoplasmic FP expression. Examples of F0 larva with likely precise (vesicular) and imprecise (cytoplasmic) mEGFP knock-in into vamp1/2 shown in B. (C) The proportion of vamp1/2 PCR-tagged larvae with likely precise (vesicular) expression pattern is higher when using end-modified HDR templates versus unmodified templates. Number of 3-4 dpf mEGFP+ F0 larva indicated in bars (includes experiments in Fig. 2 and Fig. S4). Error bars indicate 95% CI calculated using the Wilson/Brown method. **P<0.01 or ***P<0.001 (Fisher's test for vesicular versus cytoplasmic/mixed expression). Scale bars: 5 µm.
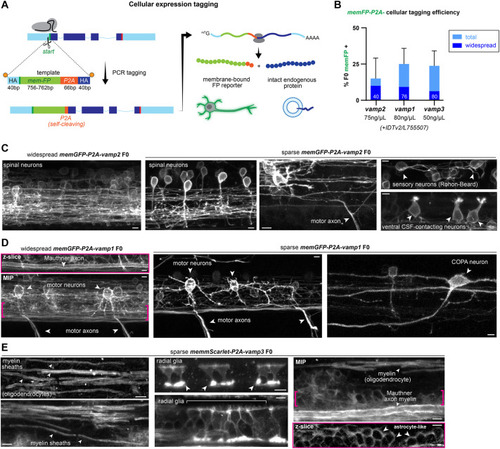
Using PCR tagging for cellular expression analysis reveals vamp cellular diversity. (A) Cellular expression tagging strategy in which a membrane-bound fluorescent protein sequence (memFP) followed by a ‘self-cleaving’ P2A peptide is knocked into the N terminus of a gene of interest. During mRNA translation, ribosomal skipping leads to separate production of memFP outlining the morphology of the expressing cells and of intact endogenous protein. HA, homology arms; m7G/AAAA, mRNA 5′-cap and polyadenylation signal. (B) Efficiency of cellular expression tagging of vamp1/2/3 homologues. Bars represent one injection round; the number of 3-5 dpf larvae analyzed n is indicated within bars. Error bars indicate 95% confidence intervals for FP+ expression (Wilson/Brown calculation). Modified HDR template concentration indicated below bars; 30 µM IDT HDR enhancer v2 or 80 µM L755507 was added in vamp1/2 or in vamp3 tagging injections, respectively. (C) vamp2 cellular expression tagging shows extensive neuronal expression throughout the spinal cord, e.g. in sensory Rohon–Beard neurons, CSF-contacting neurons and motor neurons. (D) vamp1 cellular expression tagging reveals expression in motor neurons, premotor reticulospinal neurons (e.g. the Mauthner cell) and interneuron subtypes such as commissural primary ascending (COPA) neurons. Brackets indicate region of the single z-slice shown above. (E) vamp3 cellular expression tagging reveals primarily glial expression e.g. in myelinating oligodendrocytes, radial glia and astrocyte-like cells in the ventral spinal cord. Brackets indicate region of z-slice shown below. Arrowheads point to examples of the labelled cells or structures in each panel. MIP, maximum intensity projection of z-stack. Scale bars: 5 µm.
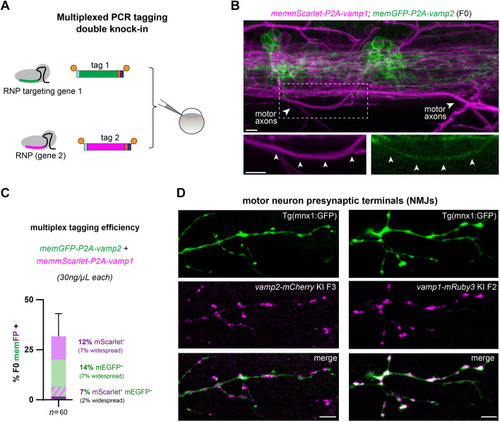
Multiplexed cellular expression tagging reveals vamp1/2 co-expression in motor axons. (A) Our optimized PCR tagging conditions facilitate multiplex knock-in in two target loci simultaneously. (B) Example memmScarlet-2A-vamp1+; memEGFP-2A-vamp2+ F0 larva shows partially overlapping expression patterns, e.g. in motor axons (arrowheads). (C) Efficiency of double cellular tagging of vamp1/2, shown as percentage of F0 larvae showing memEGFP and/or memmScarlet fluorescence. Bars represent one injection round, error bars indicate 95% confidence intervals for FP+ expression (Wilson/Brown calculation). (D) vamp1-mRuby3 or vamp2-mCherry knock-in lines crossed with transgenic motor neuron reporter mnx1:GFP confirms that both Vamp1 and Vamp2 proteins are found at the presynaptic terminals of motor neurons, i.e. the neuromuscular junctions that innervate the trunk musculature. Scale bars: 5 µm.
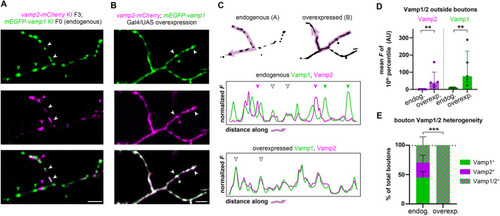
Multiplexed PCR tagging reveals vamp1/2 co-expression in motor axons. (A) A larva in which endogenous Vamp1/2 proteins are both tagged shows that synaptic boutons in individual motor axons exhibit molecular heterogeneity and can be Vamp1+ (green arrowheads), Vamp2+ (magenta arrowheads) or both Vamp1/2+ (white arrowheads). (B) An individual motor axon in which Vamp1/2 proteins are labelled using a Gal4/UAS overexpression strategy. All synaptic boutons appear to be Vamp1/2+ (white arrowheads). (C) mEGFP and mCherry fluorescence intensity profiles along the indicated arrows in motor axon terminals shown in A,B. Arrowheads indicate the terminals highlighted in A,B. Note mEGFP and mCherry overlap in overexpressed but not endogenously labelled terminals. (D) To estimate the fluorescence signal along the axon outside the synaptic boutons, the lowest 10% of the fluorescence intensity value was averaged per axon profile (plotted in arbitrary units, AU). Note significant increase in overexpression strategy. Circles indicate individual axon profiles (five axons from three endogenously tagged larvae and five axons from five overexpressing larvae) and bars indicate the median. Error bars indicate the interquartile range. **P<0.01 (two-tailed Mann–Whitney test). (E) The proportion of Vamp1+, Vamp2+ and Vamp1/2+ boutons along each motor axon. The overexpression strategy masks neuromuscular junction molecular heterogeneity. Bars indicate the proportion of each type of bouton averaged from five axons each (from three endogenously tagged and five overexpressing larvae), and error bars indicate the 95% confidence intervals (Wilson/Brown calculation). ***P<0.0001 (Fisher's exact test). Scale bars: 5 µm.
Acknowledgments
This image is the copyrighted work of the attributed author or publisher, and
ZFIN has permission only to display this image to its users.
Additional permissions should be obtained from the applicable author or publisher of the image.
Full text @ Development
Your Input Welcome
Thank you for submitting comments. Your input has been emailed to ZFIN curators who may contact you if
additional information is required.
Oops. Something went wrong. Please try again later.