Expression of uroplakin 1a in zebrafish larvae using in situ hybridization. (A) uroplakin 1a expression in the cloaca (black arrow) at 96 h post fertilization (hpf) in lateral view. (B) uroplakin 1a expression in the two pronephric ducts (red arrows) as they drain from the kidney towards the cloaca at 120 hpf in ventral view. Scale bars: 50 μm.
Anatomy of adult zebrafish mesonephric ducts and urinary bladder. Haematoxylin and Eosin stained adult zebrafish sections in transverse orientation from cranial to caudal. (A) Kidney (black outline) converges onto two mesonephric ducts (black arrows). (B) Two mesonephric ducts (black arrows) distal to the kidney in the retroperitoneum. (C) The two mesonephric ducts unite into a single urinary bladder lined with epithelial cells (red arrow). (D) Inferior aspect of the urinary bladder. Scale bars: 50 μm.
Anatomy of adult zebrafish urethra. (A) Haematoxylin and Eosin staining (sagittal orientation) of the adult female zebrafish lower urinary, intestinal and reproductive tracts, demonstrating a distinct and separate urethral orifice (black arrow), an oviduct (red arrow) and a rectum (black triangle). (B) Masson's trichrome staining demonstrating connective tissue (light green, black arrow) surrounding the female urethra. (C) Haematoxylin and Eosin staining (coronal orientation) of the adult male zebrafish lower urinary, intestinal and reproductive tracts, demonstrating a urethra (black arrow) and an ejaculatory duct (red arrow). (D) Haematoxylin and Eosin staining (coronal orientation) of the adult male zebrafish lower urinary, intestinal and reproductive tracts, demonstrating an ejaculatory duct (red arrow) opening into the urethra (black arrow) and a distinct separate rectum (white arrowhead). (E) Masson's trichrome stain of male adult lower urinary, intestinal and reproductive tracts (coronal orientation), demonstrating muscle fibres surrounding the ejaculatory duct (red arrow) and connective tissue (light green, black triangle) surrounding the urethra (black arrow). (F) Masson's trichrome staining of the male zebrafish urethra at higher magnification. Scale bars: 50 μm for A-E; 20 μm for F.
Schematic of urinary tract and gonadal structures in adult zebrafish. The urinary tract and oviducts in female adult zebrafish (A) exit via a separate urethral orifice (black arrow) and oviduct opening (red arrow), respectively. (B) The urinary tract and vas deferens in male adult zebrafish both exit via the urethral orifice (black arrow). Dotted lines illustrate the anatomical locations of key urinary tract structures in the coronal sectioning plane. Dotted line 1, coronal plane of section for the trunk of the kidney; dotted line 2, coronal plane of section for the ureter; dotted line 3, coronal plane of section for the urinary bladder; dotted line 4, coronal plane of section for the urethra. Scale bars: 0.5 cm.
Expression of GATA3 in zebrafish and human urinary bladder tissue sections using immunohistochemistry. (A,B) Haematoxylin and Eosin staining of a coronal zebrafish urinary bladder section (A) and a human urinary bladder section for reference (B). (C) Nuclear expression of GATA3 in zebrafish urinary bladder urothelium (black arrow). (D) Nuclear expression of GATA3 in human urinary bladder urothelium (red arrow). Scale bars: 20 μm in A,C; 50 μm in B,D.
Expression of uroplakins in zebrafish and human urinary bladder tissue sections using immunohistochemistry. (A) Cytoplasmic and membranous expression of the urothelium-specific protein Uroplakin 1a (Upk1a) in zebrafish urinary bladder urothelium. (B) Cytoplasmic UPK1A expression in human urinary bladder urothelium. (C) Uroplakin 2 (Upk2) expression in a zebrafish urinary bladder. (D) UPK2 expression in a human urinary bladder. (E) Upk2 expression in zebrafish mesonephric duct epithelium. (F) UPK2 expression in human ureter urothelium. Scale bars: 20 μm for A,C,E; 50 μm in B,D; 100 μm in F.
Expression of urothelial basal cell layer markers in zebrafish and human urinary bladder tissue sections using immunohistochemistry. (A) Cytoplasmic expression of Krt5 in zebrafish urinary bladder urothelium. (B) Cytoplasmic KRT5 in human urinary bladder urothelium. (C) Cytoplasmic Krt5 expression in zebrafish mesonephric duct epithelium. (D) Cytoplasmic KRT5 expression in human ureter urothelium. (E) Cytoplasmic CD44 expression in zebrafish urinary bladder urothelium. (F) Cytoplasmic CD44 expression in human urinary bladder urothelium. Scale bars: 20 μm for A,C,E; 50 μm for B,F; 100 μm for D.
Structure of zebrafish mesonephric duct and urinary bladder wall. (A) Masson's trichrome staining of a zebrafish mesonephric duct section (coronal orientation) demonstrating a connective tissue layer (light green, black arrow) deeper than the epithelial layer (black triangle). (B) Masson's trichrome staining of a human ureter section, for comparison, demonstrating a connective tissue layer (light green, black arrow) deeper than the epithelial layer (black triangle) and muscle layer (white arrow). (C) Masson's trichrome staining of a zebrafish urinary bladder section (coronal orientation), demonstrating, deeper than the epithelial layer (black triangle), a connective tissue layer (light green, black arrow) and thin muscle fibres (red fibres, red arrow). (D) Masson's trichrome staining of human urinary bladder section demonstrating, deeper than the epithelial layer (black triangle), a connective tissue layer (light green, black arrow) and a muscle layer (red fibres, red arrow). Scale bars: 20 μm in A; 250 μm in B; 10 μm in C; 200 μm in D.
Antegrade and retrograde urinary tracing studies in live adult zebrafish. Alexa 488-conjugated dextran was injected into the pericardial space and imaged in the pelvic region. (A) Bright-field image of a zebrafish with areas shown in B,C highlighted in yellow and areas shown in D-F highlighted in green. (B,C) 10 min (B) and 13 min (C) post-injection. Urinary bladder structure is outlined in white, and the expulsion of urine is marked with a white arrow. (D) Epifluorescent imaging demonstrates urinary flow to a urethra (white arrow) posterior to the anal canal (white triangle). This urinary structure is unique to the anal canal and separately expels urine (white dotted arrow). (E) Retrograde counter-injection of dextran-conjugated Alexa 568 into the anal canal (white triangle) reveals the outline of the anorectum in orange. (F) Merged image identifies a urinary channel (white arrow) separate from the anal canal (outlined in white), and the expulsion of urine (white dotted arrow). The anal fin (AF) is indicated for reference. Scale bars: 1 cm in A; 300 μm in B,C; 5 mm in D-F.
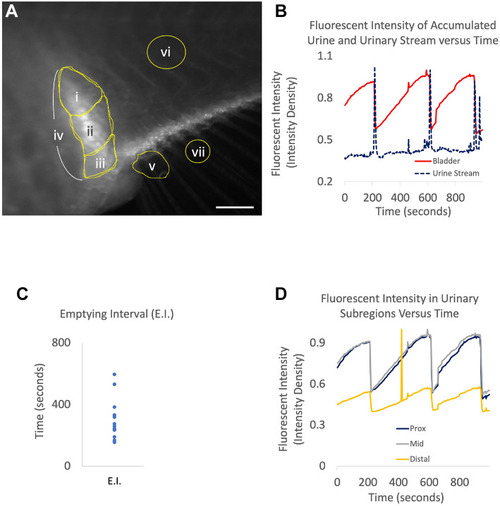
Quantification of urinary excretion in zebrafish. (A) After pericardial Alexa 488 injections, serial images were taken of zebrafish urinary structures. Scale bar: 0.4 mm. Regions of interest were identified as follows: i, proximal bladder; ii, middle bladder; iii, distal bladder; iv, total bladder; v, urinary stream. vi and vii were selected for normalization of body and urinary streams, respectively. (B) Plots of total bladder (iv) fluorescence intensity were plotted alongside urinary stream (v) intensity over time. (C) The distribution of bladder emptying intervals (E.I.) in seconds was plotted. (D) Bladder subregion fluorescent intensity plotted against time reveals that simultaneous contraction, and not sequential peristalsis, empties the full urinary bladder.
Acknowledgments
This image is the copyrighted work of the attributed author or publisher, and
ZFIN has permission only to display this image to its users.
Additional permissions should be obtained from the applicable author or publisher of the image.
Full text @ Dis. Model. Mech.
Your Input Welcome
Thank you for submitting comments. Your input has been emailed to ZFIN curators who may contact you if
additional information is required.
Oops. Something went wrong. Please try again later.