FIGURE SUMMARY
Title

Automated time-lapse data segmentation reveals in vivo cell state dynamics

Authors
Genuth, M.A., Kojima, Y., Jülich, D., Kiryu, H., Holley, S.A.
Source
Full text @ Sci Adv

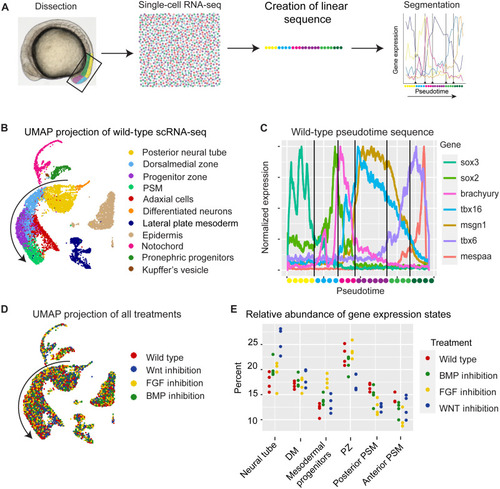
Gene expression cell states in the zebrafish tailbud.

(A) Schematic of the experimental approach. Tailbuds were dissected and pooled; scRNA-seq profiles were generated, and a one-dimensional pseudotime was created and segmented into gene expression cell states. (B) UMAP projection of scRNA-seq data colored by cell type. Arrow marks the path of pseudotime in (C). (C) Expression of selected markers over pseudotime. Vertical lines are transition points between cell states as defined by a Bayesian algorithm that minimizes within state statistical error. Note that the segment colors along the pseudotime axis correspond to the colors along the developmental trajectory (arrow) in (B) but with the PZ and PSM being further subdivided into two similarly colored segments in (C). (D) UMAP projection of scRNA-seq data colored by experimental treatment. (E) Quantification of the differences in the proportion of cells that are in a given cell state in each replicate of each experimental condition. See also figs. S1 and S2.

scRNA-seq gene expression states map to the tailbud.

(A) (i) A schematic showing the developmental trajectory of the paraxial mesoderm in the tailbud. All panels show the expression of sox2 (yellow), brachyury (cyan), tbx16 (magenta), and tbx6 (green). (ii) Fluorescent in situ hybridization maps the transcriptional states (numbered) defined by scRNA-seq onto the tailbud. In the dorsal view, the orange lines mark locations of the midsagittal (short line) and parasagittal (long line) slices. (B) Expression of tbx16 (magenta) and tbx6 (green). Vertical lines mark the transition from PZ to PSM and PSM to anterior PSM. Scale bars, 50 μm. (C) Plot of signal intensity in a representative wild-type embryo along the anterior-posterior axis. Vertical bars are cutoffs for the PZ and PSM of 20 and 85% of maximum tbx6 expression, respectively. (D) PZ length normalized to total length of PZ and PSM in wild-type, BMP-inhibited, and FGF-inhibited embryos. (E) PZ area normalized to total area in wild-type and Wnt–inhibited embryos. ***P < 0.001. n.s., not significant. See also fig. S3.

Cell motion states can be defined similarly to gene expression states.

(A) Schematic of experimental approach. Embryos were imaged with a confocal microscope, and cells were tracked. Tracks were arranged into a one-dimensional pseudotime sequence and then segmented. Last, they were mapped back onto the embryo. (B) Plot of track displacement over pseudotime. The line is the sliding window mean of 100 tracks, and shading is the SD. Vertical lines mark transitions between states. (C) Tracks mapped back onto the embryo. Tracks are colored by pseudotime segmentation. Gray circles mark cell positions at the end of the interval. Representative tracks were chosen at random. (D and E) Four segmented wild-type replicates. Dots represent position of the cells at the start of the track. Colors represent pseudotime segment. Tracks are either chosen from the start of the time lapse (D) or randomly sampled from throughout the time lapse (E). (F) Abundance of cell motion states in each replicate at each time point.

PSM exhibits significant left-right asymmetry.

(A) Cell tracks in replicated four from two different times points plotted as in Fig. 3B. Boxes mark ROIs for left and right PSM region. (B) Track statistics for cells in left and right PSM ROIs in embryo shown in (A). The left plot is abundance of PZ-type tracks [magenta color in (A)] in the PSM over time. The right plot is track displacement along the medial-lateral axis (mean and SD) over time. Positive numbers are moving toward the midline. (C) PSM region ROI statistics for the other wild-type replicates. PSM convergent behavior differs markedly between embryos and between left and right sides within embryos.

Cell motion segmentation in embryos subject to signaling perturbations.

BMP-inhibited (A), FGF-inhibited (B), and Wnt-inhibited (C) embryo cell tracks were mapped into the pseudotime sequence and then segmented using the same algorithms as the wild-type embryos. Tracks were mapped onto the embryos. Dots represent position of the cells at the start of the track. Colors represent pseudotime segment. For plotting, tracks were chosen from either the first time point or randomly sampled from across the time lapse.

PSM region cell motion dynamics after BMP, FGF, or Wnt signaling inhibition.

Track statistics in ROIs of the left and right PSM after (A) BMP inhibition, (B) FGF inhibition, or (C) Wnt inhibition. The first row in each panel displays the abundance of PZ-type (magenta colored) tracks in the PSM over time. Second row shows medial-lateral displacement (mean and SD) over time. Positive numbers represent movement toward the midline.

Summary of cell state transitions.

(A) Illustration of gene expression states. (B) Schematic of how time averaging creates consistent, left-right symmetric development both in individual embryos and in populations.

Acknowledgments
This image is the copyrighted work of the attributed author or publisher, and ZFIN has permission only to display this image to its users. Additional permissions should be obtained from the applicable author or publisher of the image. Full text @ Sci Adv