
- Title
-
Effect of caldesmon mutations in the development of zebrafish embryos
- Authors
- Virtanen, V., Paunu, K., Niva, S., Sundvall, M., Paatero, I.
- Source
- Full text @ Biochem. Biophys. Res. Commun.
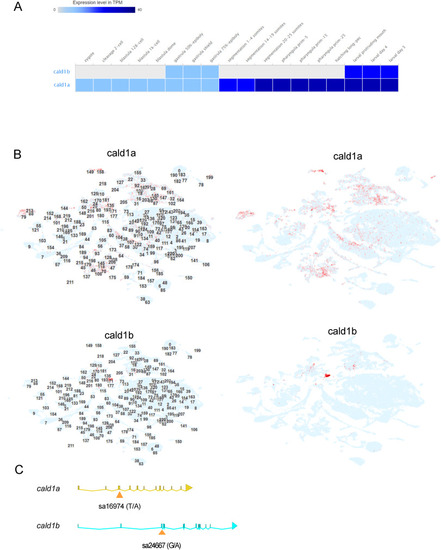
The in silico analysis of cald1a and cald1b mRNA expression, and the mutations (A) Whole-embryo RNA-seq data for cald1a and cald1b from zebrafish embryo developmental time series. Data obtained from Expression Atlas (www.ebi.ac.uk/gxa/home, dataset E-ERAD-475, data downloaded January 3rd, 2023). (B) Single-cell RNA-seq data for developing zebrafish embryos. Data obtained from USCS Cell Browser (http://cells.ucsc.edu/?ds=zebrafish-dev, data obtained January 3rd, 2023). The numbers in left panels refer to cell cluster ID numbers and in the right panels these are omitted for clarity. (C) Schematic illustration of the location of mutations in cald1a and cald1b genes. Exons are marked as bars and connected by lines representing introns. Mutation sa24667 locates in exon 3 of cald1a, disrupting the essential splice site. The first 67 amino acids of 778 amino acids in cald1a are predicted to be intact in cald1a(sa24667) mutant. Mutation sa16974 locates in exon 3 and creates a premature stop codon. The first 190 amino acids of 778 amino acids in cald1b are predicted to be intact in cald1b(sa16974) mutant. |
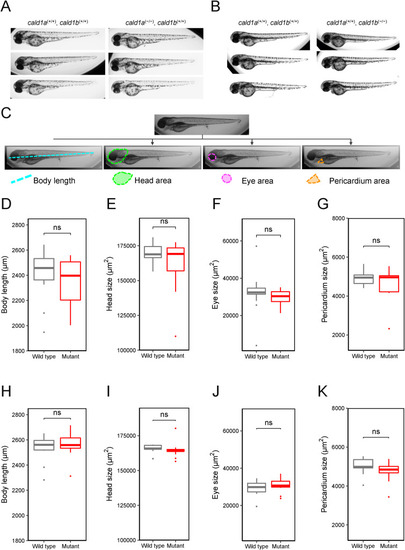
Analyses of the anatomy of cald1a and cald1b single-mutant zebrafish. (A) Representative brightfield images of wild-type zebrafish larvae cald1a (+/+), cald1b (+/+) (left) and single-mutant zebrafish larvae cald1a (−/−), cald1b (+/+) (right) 4 dpf. (B) Representative brightfield images of wild-type zebrafish larvae cald1a (+/+), cald1b (+/+) (left) and single-mutant zebrafish larvae cald1a (+/+), cald1b (−/−) (right) 4 dpf. 19) (C) Schematic illustration of the measurements taken from the zebrafish larvae. Body length, head area, eye area and pericardium area are highlighted over the duplicates of the original image with teal, green, purple, and orange, respectively. (D–G) Morphological measurements and analyses display no statistically significant changes in body length, head size, eye size, and in pericardial area when compared wild-type cald1a (+/+), cald1b (+/+) (n = 22) larvae to single-mutant larvae cald1a (−/−), cald1b (+/+) (n = 12). All measurements were done by two independent investigators. (H–K) Morphological measurements and analyses display no statistically significant changes in body length, head size, eye size, and in pericardial area when compared wild-type cald1a (+/+), cald1b (+/+) larvae (n = 13) to single-mutant larvae cald1a (+/+), cald1b (−/−)(n = 19). All measurements were done by two independent investigators. (For interpretation of the references to colour in this figure legend, the reader is referred to the Web version of this article.) PHENOTYPE:
|

cald1a and cald1b mutant mRNAs have abnormal expression levels. (A) Relative cald1a mRNA expressions in different genotypes of cald1a (left) (nWT = 5, n(±) = 15, and n(−/−) = 4). (B) Relative cald1b mRNA expressions in different genotypes of cald1b (right) (nWT = 4, n(±) = 14, and n(−/−) = 4) in zebrafish larvae (C) Relative cald1b mRNA expressions in different genotypes of cald1a (right) (nWT = 5, n(±) = 13, and n(−/−) = 4). (D) Relative cald1a mRNA expressions in different genotypes of cald1b (left) (nWT = 4, n(±) = 14, and n(−/−) = 4) in zebrafish larva. ns = not significant, ∗p < 0.05, ∗∗p < 0.01, and ∗∗∗p < 0.001 as determined by ANOVA. |
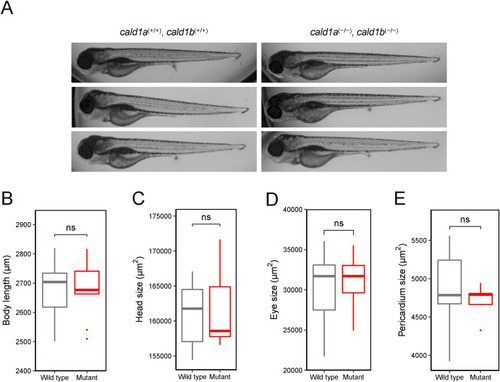
cald1a, cald1b double-mutant zebrafish have no significant morphological phenotype (A) Representative brightfield images of wild type zebrafish larvae cald1a (+/+), cald1b (+/+) (left) and mutant zebrafish larvae cald1a (−/−), cald1b (−/−) (right) at 4 dpf. (B–E) Morphological measurements and analyses display no statistically significant changes (ns) in body length, head size, eye size, and in the pericardial area when compared wild type cald1a (+/+), cald1b (+/+) larvae (n = 15) to double-mutant cald1a (−/−), cald1b (−/−) larvae (n = 10). PHENOTYPE:
|
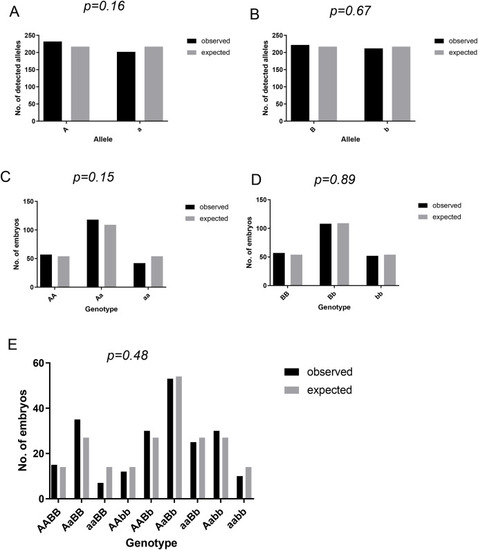
Mutation of cald1a and cald1b genes is not lethal for zebrafish larvae Analyses of zebrafish allele frequencies and genotype of offspring. Fish heterozygous for both cald1a and cald1b mutation were incrossed in a dihybrid cross. All embryos were genotyped and observed counts (n = 217) were statistically compared to expected counts using binomial (A and B) or Chi-square (C, D, and E) test. (A) Count of detected alleles of cald1a wild-type (marked with A) and sa24667 mutant (a) allele. (B) Count of detected alleles of cald1b wild-type (marked with B) and sa16974 mutant (b) allele. (C) Distribution of cald1a genotypes. (D) Distribution of cald1b genotypes. (E) Distribution of cald1a, cald1b dihybrid genotypes. PHENOTYPE:
|
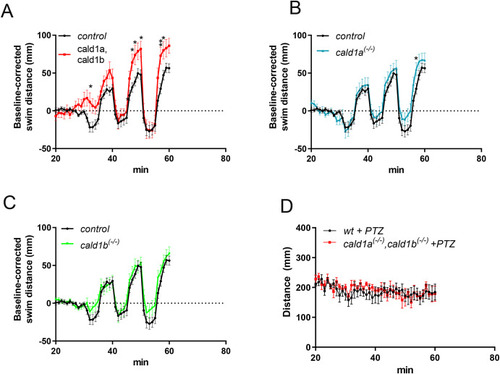
Cald1 mutation has mild locomotory phenotype in zebrafish larvae Analyses of behavior and locomotion of cald1a and cald1b mutants in 96-well assay using DanioVision instrument. After the adaptation phase, an alternating light-dark cycles (5min light, 5min darkness) were used to stimulate movements. Some genotypes were pooled to increase statistical power. A) control (n = 52, genotypes wt; cald1a+/− and cald1b+/−) vs cald1a, cald1b double-mutants (n = 13, genotypes, cald1a−/−, cald1b−/−), B) control vs cald1a mutants (n = 24, genotypes cald1a−/− and cald1a−/−, cald1b+/−), C) control vs cald1b mutants (n = 38, genotypes cald1b−/− and cald1b−/−,cald1a+/−), D) Stimulation of wt (n = 5) or cald1a,cald1b mutants (n = 5) with pentylene tetrazolium (PTZ). In A-C the same control data are shown as reference. PHENOTYPE:
|