- Title
-
Drug screening in zebrafish larvae reveals inflammation-related modulators of secondary damage after spinal cord injury in mice
- Authors
- Oprişoreanu, A.M., Ryan, F., Richmond, C., Dzekhtsiarova, Y., Carragher, N.O., Becker, T., David, S., Becker, C.G.
- Source
- Full text @ Theranostics
|
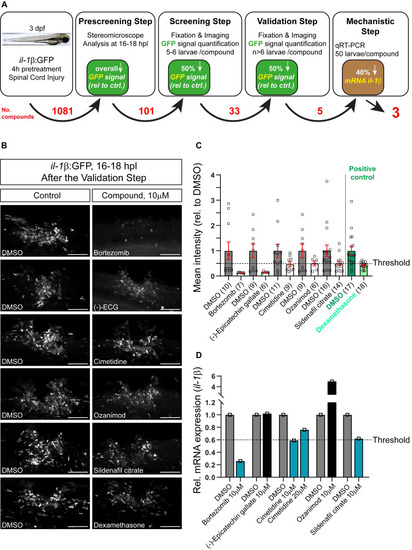
Screening of an Il-1β reporter fish reveals drugs that reduce endogenous Il-1β mRNA expression. A: Schematic representation of the drug screening workflow. Briefly, 3 dpf larvae were pre-treated with various compounds for 4 hours, followed by manual injury. Next day, larvae that showed an overall decrease in GFP signal (pre-screening) were fixed, fluorescence was quantified (screening step) and positive compounds were re-tested (validation) and mechanistically tested by qRT-PCR for il-1β mRNA. The numbers of tested compounds after each screening step are depicted in red. B: Representative images of 16-18 hpl drug-treated larvae are shown, including negative (DMSO) and positive control (dexamethasone). C: Quantification of the overall GFP fluorescence signal relative to DMSO-treated control is shown for the validation step. All five compounds elicit a ≥50% drop in the overall GFP signal. Dexamethasone treatment (positive control) induced an approx. 50% decrease in overall GFP signal versus control. D: Three out of five compounds lead to a reduction in the relative il-1β mRNA expression in wild-type larvae (50 treated or control larvae were pooled per measurement). Cimetidine (10 µM) and sildenafil citrate lead to a 40% reduction in il-1β mRNA expression, while bortezomib leads to a 70% reduction. Scale bars: 100 µm EXPRESSION / LABELING:
PHENOTYPE:
|
|
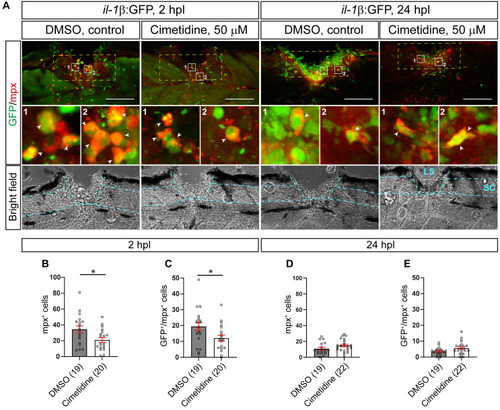
Cimetidine reduces the number of neutrophils in the injury site. A: Representative images of the lateral view of the injury site in the il-1β:GFP line treated with cimetidine and DMSO-control are shown. Broken blue lines outline spinal cord (SC) and lesion site (LS). B, C: At 2 hpl, the total number of neutrophils (B, mpx+, t-test, p* = 0.0143), and the number of double positive neutrophils (C, GFP+/Mpx+ t-test, p* = 0.0279) are reduced by cimetidine treatment. D, E: At 24 hpl, the number of double-positive cells is not altered by cimetidine treatment. Broken yellow lines outline the area of quantification. Scale bar: 100 µm. PHENOTYPE:
|
|
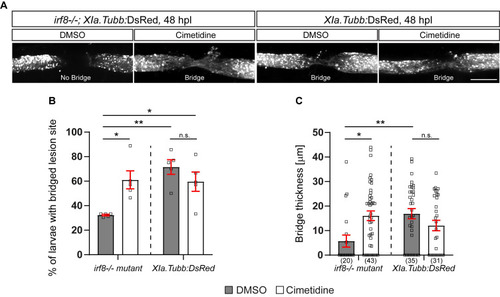
Cimetidine partially rescues impaired axonal regeneration in irf8 mutant zebrafish. A: Representative images of the lateral view of the injury site in cimetidine- and DMSO-treated larvae are shown. An axonal connection across the injury is visualized with DsRed, expressed under a neuronal promoter. Presence of an axonal bridge is indicated in the images. B: Quantification by scoring of animals for the presence of an axonal bridge indicates that Cimetidine increases the proportion of irf8 mutant larvae with an axonal bridge (two-way ANOVA, interaction effect F(1, 16) = 10.86, p* = 0.0046; Tukey's multiple comparison test, irf8 mutant, DMSO vs irf8 mutant, cimetidine p* = 0.0215, irf8, DMSO vs wt, DMSO p** = 0.0019, irf8, DMSO vs wt, cimetidine p* = 0.0295), but does not affect wild-type regeneration. C: Measuring the thickness of the axonal bridge yielded similar results for the experimental groups (two-way ANOVA, interaction effect F(1, 125) = 11.60, p*** = 0.0009; Tukey's multiple comparison test, irf8 mutant, DMSO vs irf8 mutant, cimetidine p* = 0.0112, irf8 mutant, DMSO vs wt, DMSO p** = 0.0074). Scale bar: 100 µm PHENOTYPE:
|
|
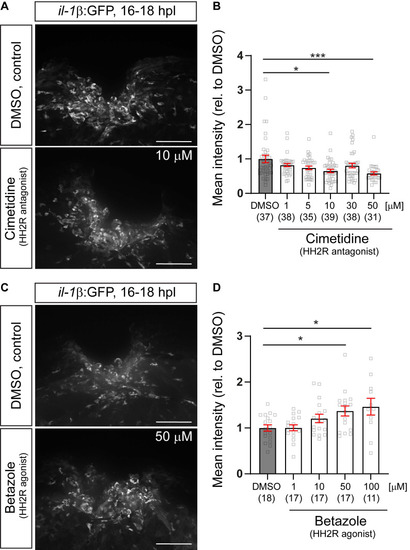
Pharmacological manipulations HH2R receptor activity indicates positive regulation of il-1β expression by the receptors. A: Representative images of the injury site in il-1β:GFP line treated with 10µM cimetidine, or DMSO are shown. |
|
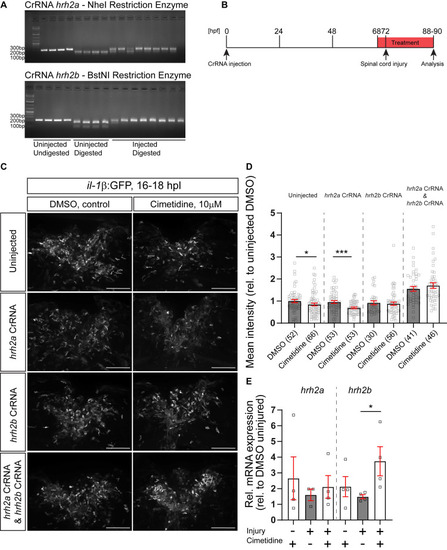
Somatic receptor mutation indicates that Cimetidine acts through hrh2b in zebrafish. A: Examples of gels used to assess the efficiency of injected CrRNA by RFLP are shown. Each lane represents one embryo. In uninjected controls, a complete band shift is observed, indicating activity of the indicated restriction enzyme, whereas in 8 haCR-injected animals almost no digest occurs, indicating successful mutation of the recognition site. B: A schematic timeline of the experimental design, combining somatic mutation with drug treatment is depicted. C: Lateral view of the spinal cord injury sites in somatic mutant larvae with and without Cimetidine treatment are shown. D: Quantification of the overall GFP fluorescence of the cimetidine-treated somatic receptor mutants relative to DMSO-treated control indicate that in condition in which hrh2b haCRs were injected the effect of Cimetidine is abolished. (uninjected condition, Mann-Whitney tests, p* = 0.0373; hrh2a CrRNA condition, t-test, p*** = 0.0005). E: Cimetidine treatment leads to an increase in the relative hrh2b mRNA expression in lesioned wild-type larvae (50 treated or control larvae were pooled per measurement; Kruskal-Wallis test, p* = 0.0242 with Dunn's multiple comparisons test: injured, DMSO vs injured, cimetidine p* = 0.0324). hrh2a mRNA expression is unaffected by cimetidine treatment. Scale bars: 100µm. |
|
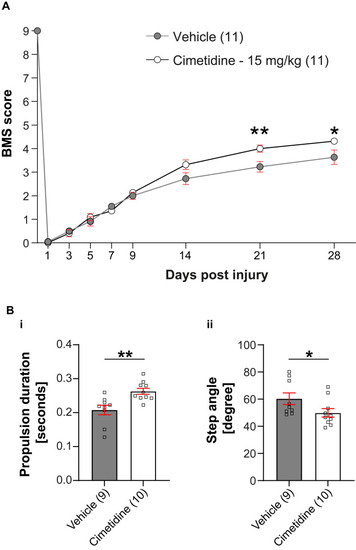
Cimetidine improves locomotor recovery after spinal injury in mice. A: Locomotor recovery was assessed using the 9-point Basso Mouse Scale (BMS) analysis. Mice treated with Cimetidine at 15mg/kg under the same conditions showed statistically significant improvement in locomotor control starting at day 21 post-injury (Two-way RM-ANOVA; interaction effect F(8,160) = 4.610, p < 0.0001; with post-hoc Bonferroni multiple comparison test; p(21d) = 0.0058, p(28d) = 0.0225, n = 11 mice per group). B: DigiGait analysis shows significant improvement in propulsion duration (i) and decrease in step angle (ii) with Cimetidine treatment both indicators of improved gait control. (Vehicle vs. Cimetidine: two-tailed Mann Whitney U-test, propulsion duration: p** = 0.0016; step angle: p* = 0.0279; n = 9-10 mice per group). |
|
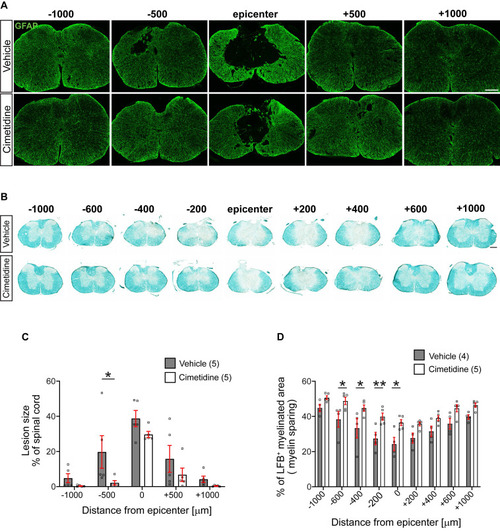
Treatment with Cimetidine reduces secondary damage induced by spinal cord contusion injury in mice. A: Confocal images of the spinal cord at 28-day survival after injury stained with anti-GFAP are shown. Note that the size and extent of the lesion is smaller in the Cimetidine treated group compared to the vehicle-treated control (quantified in C). B: Luxol fast blue (LFB) stained sections of the spinal cord 28 days after SCI. Note greater sparing of myelin LFB staining in the Cimetidine-treated group (quantified in D). C: Quantification of tissue loss is shown. Note although the mean values in the Cimetidine treated group are smaller than in the vehicle-treated group, the value reaches statistical significance only at - 500 µm rostral to the lesion due to the variability between animals (Two-way RM-ANOVA; group effect F(1,8) = 3.188, p = 0.1120; with Sidak's multiple comparison test; p*(-500) = 0.0372, n = 5 mice per group. Note also that the longitudinal extent of the lesion is smaller in the Cimetidine-treated group. D: Mice treated with Cimetidine show a significant reduction of myelin loss (LFB staining) from the center of the lesion to 600 μm rostrally (Two-way RM-ANOVA; group effect F(1,7) = 12.35, p = 0.0098; with post-hoc Bonferroni multiple comparison test; p*(-600µm) = 0.0438, p*(-400µm) = 0.0204, p**(-200µm) = 0.0084, p*(center) = 0.0103, n = 4-5 mice per group). Scale bars = 200 µm. |
|
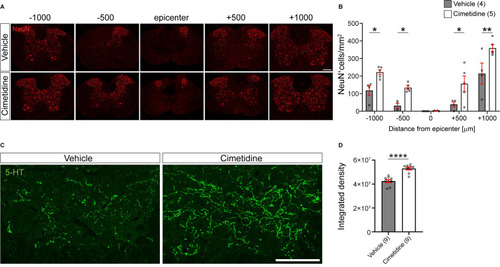
Cimetidine treatment leads to higher density of neurons and greater serotonergic innervation after spinal cord injury in mice. A: Single plane confocal images of spinal cord cross-sections 28 days after spinal cord contusion injury stained with anti-NeuN antibody to label neurons. Note the greater sparing of neurons in the Cimetidine-treated animal compared to the vehicle group. B: Quantification of NeuN labeling in the ventral horn is shown. Mice treated with Cimetidine showed increased survival of NeuN+ neurons in the ventral horn of the spinal cord as compared to controls on either side of the lesion center (Two-way RM-ANOVA; group effect F(1,7) = 20.65, p = 0.0027; with post-hoc Bonferroni multiple comparison test; p*(-1000µm) = 0.0448, p*(-500µm) = 0.0496, p*(+500µm) = 0.0172, p**(+1000µm) = 0.0024, n = 4-5 mice per group.) C: Increased serotonergic innervation of the ventral horn treated with Cimetidine is observed at 1mm caudal to the lesion center by 5-HT immunohistochemistry. D: Quantification by optical density measurements shows that there is significantly greater 5-HT innervation in Cimetidine treated mice than in vehicle-treated controls. Mann-Whitney unpaired t test, p ≤ 0.0001, n = 9 per group; Scale bar = 200 µm and 100 µm for A and C, respectively. |
|
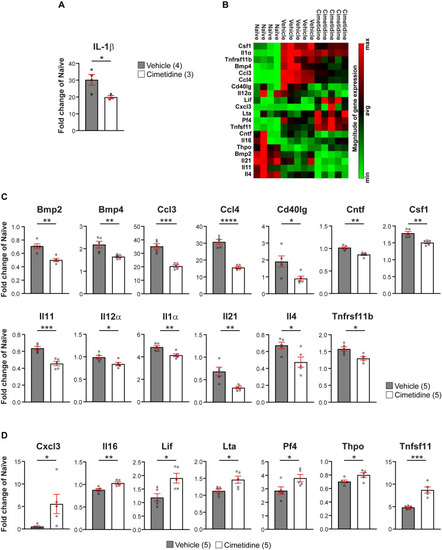
Cimetidine changes the cytokine profile of the injury site in mice. A: qRT-PCR shows significant decrease in il-1β mRNA expression after 1 day of Cimetidine treatment (one-way ANOVA with Tukey's multiple comparison test, p**** < 0.0001, vehicle vs. cimetidine p* = 0.0219). B: Results of the RT2 profiler cytokine array (PAMM-150Z) after 10 days of Cimetidine treatment depicted as a heat map indicating genes with decreased (green) and increased (red) transcript levels (quantification shown in C and D) in individual mice in the three indicated groups is shown. C: Quantification of genes with decreased transcript levels is shown for B. D: Quantification of genes with increased transcript levels is shown for B. Statistics for C,D: vehicle vs. cimetidine: two-tailed Mann Whitney U-test for all comparisons; Bmp2: p** = 0.0012; Bmp4: p** = 0.009; Ccl3: p*** = 0.0002; Ccl4: p**** ≤ 0.0001; Cd40lg: p* = 0.0238; Cntf: p** = 0.0013; Csf1: p** = 0.0023; Il11: p*** = 0.0007; Il12α: p* = 0.0219; Il1α: p** = 0.0069; Il21: p** = 0.0073; Il4: p* = 0.0257; Tnfrsf11b: p* = 0.0104; Cxcl3: p* = 0.0469; Il16: p** = 0.0065; Lif: p* = 0.0148; Lta: p* = 0.0264; Pf4: p* = 0.0418; Thpo: p* = 0.0425; Tnfsf11: p*** = 0.0005; n = 4-5 mice per group. |

