
- Title
-
Nanoparticle-based targeting of microglia improves the neural regeneration enhancing effects of immunosuppression in the zebrafish retina
- Authors
- Emmerich, K., White, D.T., Kambhampati, S.P., Casado, G.L., Fu, T.M., Chunawala, Z., Sahoo, A., Nimmagadda, S., Krishnan, N., Saxena, M.T., Walker, S.L., Betzig, E., Kannan, R.M., Mumm, J.S.
- Source
- Full text @ Commun Biol
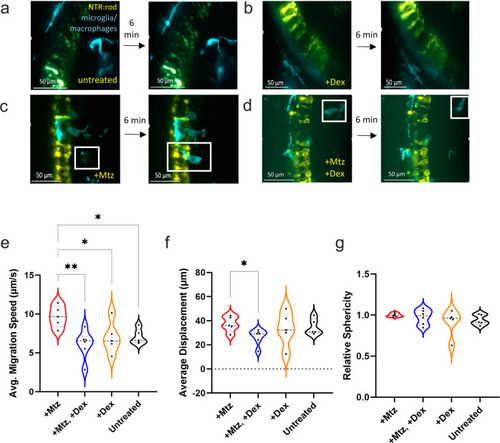
Microglia reactivity is altered in response to post-ablation Dex treatment.
a–d Image stills 6 min apart from AO-LLSM imaging of 5 or 6 dpf transgenic lines labeling NTR-expressing rods (yellow) and microglia/macrophages (cyan). Four conditions were imaged: non-ablated “untreated” control (A), non-ablated, “+Dex” (B), rod cell ablated, “+Mtz” (C), and rod cells ablated with Dex treatment, “+Mtz, +Dex” (D). In all images, the inner nuclear layer is to the right of the NTR-YFP rod cells. e–g Imaris quantification of average migration speed (μm/second), average displacement (μm), and relative sphericity of microglia in each larva, sample sizes for each plot from left to right: 5, 6, 5, 6 with a total of 66 microglia analyzed. See Supplementary Movies 1-4 corresponding to stills A-D, respectively. Asterisks indicate statistically significant differences between the indicated groups (*p ≤ 0.05, **p ≤ 0.01), all other comparisons were not statistically significant. Lines within the violin data for each condition for all plots indicate lower quartile (bottom), median (middle line), and upper quartile (top). |

Dendrimer conjugation eliminates Dex-mediated toxicity in larval zebrafish.
a Schematic of injection assay to test dendrimer, Dex and D-Dex toxicity. At 6 dpf, dendrimer, “free” Dex, or D-Dex were injected into the pericardium of zebrafish larvae (~10 nL injected volume, 2.5-400 µM for Dex and D-Dex). At 7 dpf, toxicity was quantified based on percent survival across 24 fish per condition over two trials. b Line graph indicating average toxicity at 7 dpf for dendrimer (black line), Dex (blue line), and D-Dex (orange line). Comparisons between Dex or D-Dex and dendrimer alone controls showed statistically significant increases in toxicity for Dex-injected larvae only (100-400 μM, *p ≤ 0.05, ***p ≤ 0.001, ****p ≤ 0.0001, respectively). |

Dendrimers localize to reactive microglia following rod cell ablation.
a Process for conjugating Cy5 to PAMAM G4-OH dendrimers (D-Cy5) using Cy5 NHS and borate buffer. b Assay schematic: transgenic zebrafish expressing NTR:rod (yellow) and microglia/macrophages (red) were treated with 2.5 mM Mtz from 5–7 dpf to induce rod cell loss. At 6 dpf, fish were given PC injections of D- Cy-5 (cyan, 2 ng/ul) and imaged using in vivo confocal time series microscopy. c Image stills from representative larva at 0, 2, and 4 hpi with all three channels (top panels) or with the yellow channel removed (bottom panels); insets and orange circles highlight interactions between dendrimers (cyan) and microglia (red). See Supplementary Movie 6 for the time-lapse sequence. d Three (left) and two-channel (right) images still from control non-ablated larva at 2 hpi of D-Cy5; orange circles highlight interactions between dendrimers (cyan) and microglia (red). e Imaris-based quantification of normalized colocalization between microglia (red) and D-Cy5 (cyan) signals in retinas treated ±Mtz (n = 4 larvae per condition), +Mtz values were normalized to paired sibling (−Mtz) control fish imaged on the same day (*p ≤ 0.05). |

D-Dex further enhances the regeneration-promoting effects of Dex and induces proliferation.
a Assay schematic for data in (b): 5 dpf NTR-rod larvae were exposed to 10 mM Mtz for 24 h and then separated into 5 groups, (1) “+Mtz”; (2) exposed to 2.5 μM free Dex from 6–9 dpf, “+Mtz, +Dex (soak)”; or injected at 6 dpf with either (3) 5 μM free Dex, “+Mtz, +Dex (inj)”; (4) 5 μM D-Dex, “+Mtz, +D-Dex (inj)”, or (5) dendrimers alone, “+Mtz, +Dendrimer (inj)”. At 9 dpf (4 dpa) NTR-YFP rod signal was quantified by plate reader assay. b Quantification of NTR-YFP signals at 9 dpf (4 dpa) to assess rod cell regeneration kinetics, n = 77, 58, 60, 44, and 28 larvae from left to right (*p ≤ 0.05, **p ≤ 0.01, ****p ≤ 0.0001). c Representative sections from 8 dpf larvae treated with either 10 mM Mtz only from 5–6 dpf, D-Dex injection only at 6 dpf, or Mtz (5–6 dpf) followed by D-Dex injection at 6 dpf. Images show NTR:rod cells (yellow), DAPI (blue, nuclei), and immunostaining for PCNA (red, proliferating cells). d Quantification of PCNA+ cells (not counting the CMZ region), n = 8, 9, and 10 from left to right. e Representative sections from 10 dpf larvae treated with either 10 mM Mtz only from 5–6 dpf or Mtz followed by D-Dex injection at 6 dpf. Images show NTR:rod cells (yellow), DAPI (blue, nuclei) and immunostaining for BrdU (red, proliferating cells). f Quantification of NTR-YFP-expressing rod cells, n = 14 for each group. g Quantification of BrdU+ cells, n = 14 for each group (*p ≤ 0.05, **p ≤ 0.01, ****p ≤ 0.0001, all others showed non-statistically significant differences). |

RNA-seq identifies differentially expressed genes following D-Dex treatments.
a Assay schematic for RNA-seq assays. Eyes from NTR:rod larvae across four conditions (untreated, Mtz only, +Mtz, +D-Dex, or D-Dex only) were collected at 7 dpf, 24 h following D-Dex injections (where applicable) and processed for RNA sequencing. b Subset of most statistically significant DEGs across conditions (red indicates upregulation, blue indicates downregulation). c Number of up and downregulated DEGs associated with select GO terms. Fish icons in panel (a) were produced with permission from Biorender. |
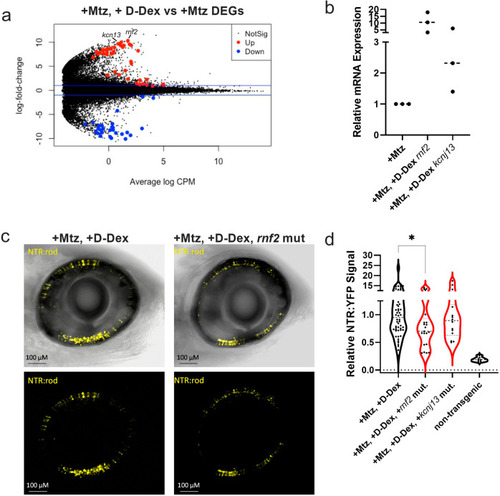
The E3 ubiquitin ligase rnf2 is required for D-Dex enhanced regeneration.
a Volcano plot of DEGs between Mtz only and +Mtz, +D-Dex treated eyes. Red indicates statistically significant upregulation and blue indicates statistically significant downregulation. b qRT-PCR assessment of rnf2 and kcnj13 upregulation in the +Mtz, +D-Dex condition. c Quantification of NTR-YFP-expressing rod cells at 9 dpf to assess changes in regeneration kinetics in +Mtz, +D-Dex larvae following knockdown of rnf2 and kcnj13, n = 54, 22, 24, and 7 from left to right (*p ≤ 0.05). d Representative in vivo confocal images of NTR-rod larval retinas at 9 dpf following +Mtz, +D-Dex treatments in either wildtype control (left) or rnf2 knockdown “crispant” backgrounds. Sample sizes from left to right: 54, 21, 14, and 7. |