
- Title
-
A comprehensive untargeted metabolomics study in zebrafish embryos exposed to perfluorohexane sulfonate (PFHxS)
- Authors
- Xu, M., Legradi, J., Leonards, P.
- Source
- Full text @ Sci. Total Environ.
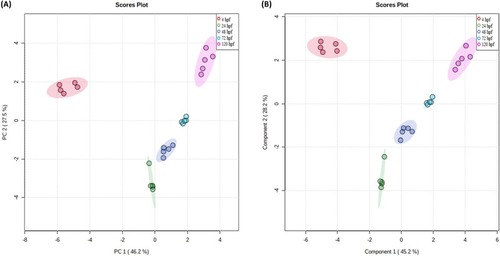
PCA (A) and PLS-DA (B) plots representing the metabolite profiling of zebrafish embryos at 4, 24, 48, 72, and 120 hpf. |
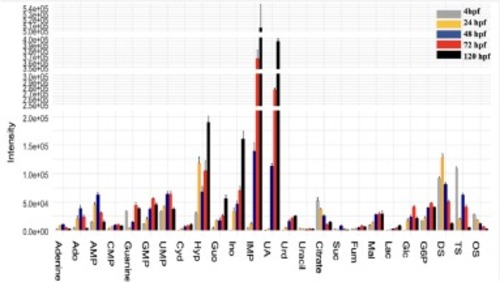
The relative response of metabolites representative of various classes in zebrafish embryos at different developmental stages: 4 hpf (darkgrey), 24 hpf (orange), 48 hpf (darkblue), 72 hpf (red), and 120 hpf (black). All of the shown metabolites are significant compared to 4 hpf, for more details about significant differences between groups see Supplementary Materials. |
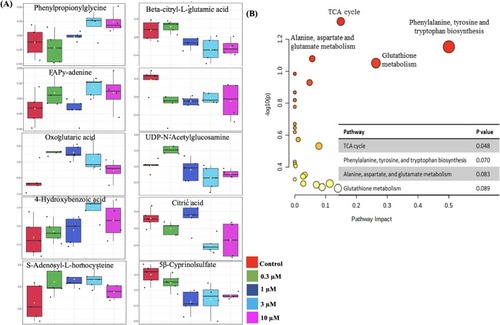
In zebrafish at 120 hpf, (A): Example of significantly affected metabolites by exposure to PFHxS at 0.3 μM (green), 1 μM (purple), 3 μM (blue), and 10 μM (pink), compared to the controls (red). (B): The four most affected metabolic pathways by 3 μM PFHxS. Other significantly affects metabolites can be found in Supplemental Materials. |
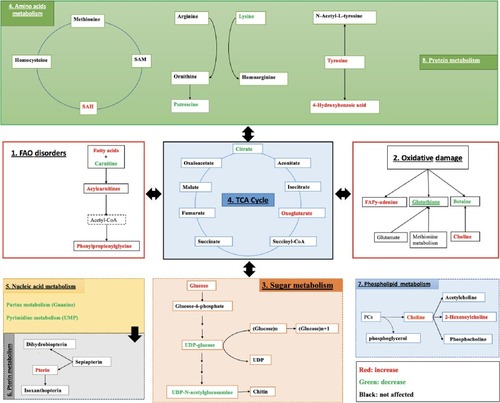
An overview of the dysregulated metabolic pathways by PFHxS and the affected metabolites by 3 μM PFHxS in zebrafish embryos at 120 hpf. |