
- Title
-
Electrical impedance myography detects age-related skeletal muscle atrophy in adult zebrafish
- Authors
- Rutkove, S.B., Callegari, S., Concepcion, H., Mourey, T., Widrick, J., Nagy, J.A., Nath, A.K.
- Source
- Full text @ Sci. Rep.
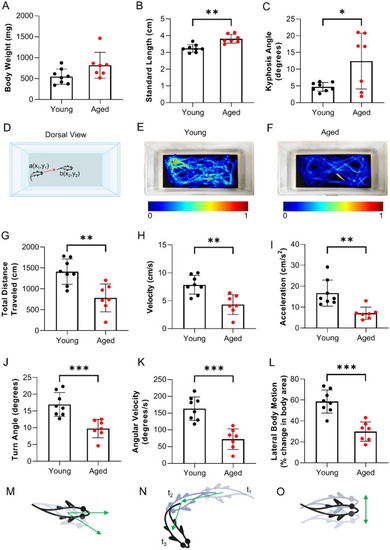
Swimming performance in adult zebrafish declines with age. Measurements of (A) body weight, (B) standard length, and (C) kyphosis angle in young and aged zebrafish. (D) Diagram of the testing area. (E,F) Heat maps depicting the time spent by animals in each (x,y) coordinate position. Locomotor measurements of (G) total distance traveled (q = 0.0039), (H) velocity (q = 0.0027), (I) acceleration (q = 0.0027), (J) turn angle (q = 0.0009), (K) absolute angular velocity (q = 0.0009), and (L) lateral body motion (q = 0.0013) (n = 7–8). Depiction of (M) turn angle, (N) angular velocity, and (O) lateral body motion. Data are presented as the mean ± SD. |

Age-related atrophy of skeletal muscle myofibers in zebrafish. (A) Red bar denotes the cross-sectional position for histological analysis of caudal skeletal muscle tissue, and (B) a representative H&E-stained section of that region. (C) Diagram of caudal musculature in zebrafish including the location of epaxial and hypaxial muscles. The gray box denotes the area used for histological analysis. Representative H&E images from (D) young and (E) aged zebrafish. Muscle fiber morphometric measurements of (F) cross-sectional fiber area (q = 0.0043), (G) fiber perimeter (q = 0.0015), (H) space between myofibers (q = 0.0015), (I) total muscle area (q = 0.0004), (J) number of fibers per unit area (q = 0.0020), and (K) distribution of the sizes of fiber area in young and aged animals (n = 7–8). Data are presented as mean ± SD. |

Electrical impedance myography detects age-related muscle changes in zebrafish. Multifrequency graphs (1 kHz–1 MHz) for (A) phase, (B) reactance and (C) resistance. Single frequency analyses at 2, 50 and 1000 kHz. (D) 2 kHz phase (q = 0.0085), (E) 2 kHz reactance (q = 0.0371), (F) 2 kHz resistance, (G) 50 kHz phase, (H) 50 kHz reactance, (I) 50 kHz resistance, (J) 1000 kHz phase, (K) 1000 kHz reactance , (L) 1000 kHz resistance (not FDR significant but nominally significant), (M) Cole parameter fc (q = 0.0181), (N) Cole parameter ratio R0/R∞, and (O) Cole parameter alpha (n = 6–7). Data are presented as mean ± SEM. |

Age-related changes in zebrafish muscle morphology correlate with electrical impedance myography measurements in caudal muscle. Correlation between 2 kHz phase values and morphological features: (A) cross-sectional fiber area, (B) space between myofibers, and (C) total muscle area for young and aged zebrafish combined. Correlation between Cole parameter fc and (D) cross-sectional myofiber area, (E) space between myofibers, and (F) total muscle area for young and aged zebrafish data combined. Spearman r and p values are shown in each panel. |

Swim performance deficits in aged zebrafish correlate with electrical impedance myography measurements of caudal muscle resistance. Correlation between 2 kHz phase values and motor traits: (A) total distance traveled, (B) velocity, (C) acceleration, (D) turn angle, (E) angular velocity, and (F) lateral motion for young and aged zebrafish data combined. Correlation between fc (kHz) values and motor traits: (G) total distance traveled, (H) velocity, (I) acceleration, (J) turn angle, (K) angular velocity, and (L) lateral motion for young and aged zebrafish data combined. Spearman correlation r and p values are shown in each panel. |