
- Title
-
Abrogation of MAP4K4 protein function causes congenital anomalies in humans and zebrafish
- Authors
- Patterson, V., Ullah, F., Bryant, L., Dong, L.I., Griffin, J.N., Sidhu, A., Saliganan, S., Blaile, M., Saenz, M.S., Smith, R., Ellingwood, S., Grange, D.K., Hu, X., Mireguli, M., Luo, Y., Shen, Y., Mulhern, M., Zackai, E., Ritter, A., Izumi, K., Hoefele, J., Wagner, M., Riedhammer, K.M., Seitz, B., Robin, N.H., Goodloe, D., Mignot, C., Keren, B., Cox, H., Jarvis, J., Hempel, M., Gibson, C.F., Tran Mau-Them, F., Vitobello, A., Bruel, A.L., Sorlin, A., Mehta, S., Raymond, F.L., Gilmore, K., Powell, B.C., Weck, K., Li, C., Vulto-van Silfhout, A.T., Giacomini, T., Mancardi, M.M., Accogli, A., Salpietro, V., Zara, F., Vora, N.L., Davis, E.E., Burdine, R.D., Bhoj, E.
- Source
- Full text @ Sci Adv
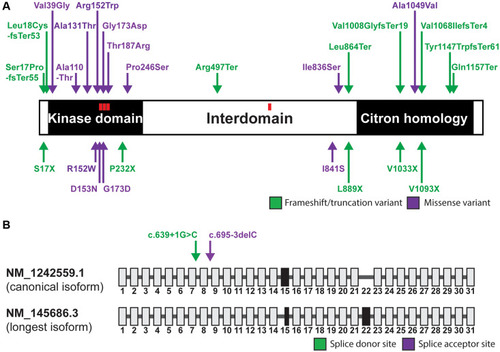
MAP4K4 variants identified in affected individuals cluster in functional domains.
(A) A schematic of the mitogen-activated protein kinase kinase kinase kinase 4 (MAP4K4) protein is shown (NP_001229488.1), with the positions of variants identified in our cohort indicated by arrows above the diagram. Green arrows represent frameshift or truncation variants, and purple arrows represent missense variants. Arrows below the diagram represent the corresponding mutations introduced to our expression construct (NM_001384485.1, Δ2078-2083). Regions reported to be phosphorylated are shown by red squares. (B) A schematic of the canonical transcript and a longer isoform are shown. Gray boxes represent exons conserved between sequences, and black boxes represent exons that differ between sequences. Green arrows represent variants in splice donor sites, and purple arrows represent variants in splice acceptor sites. |
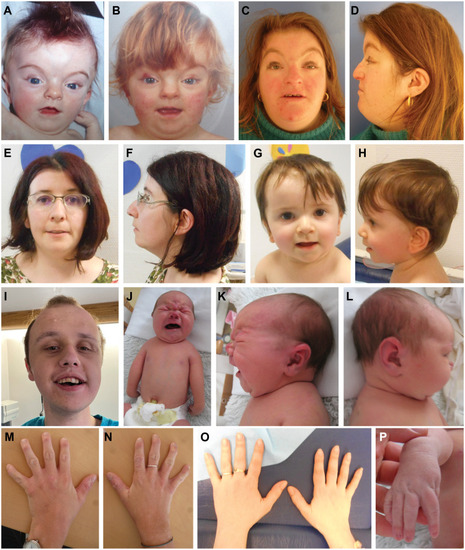
Affected individuals display CFAs and limb abnormalities.
(A to D) Affected individual at the age of 4 months (A), 14 months (B), and 28 years (C and D). Individual displays ptosis, high arched eyebrows, broad nasal root, thin lips, and posteriorly rotated ears. (E to H) Affected mother at 29 years of age (E and F) and her affected child (G and H) at 11 months of age. Individuals display down-slanting palpebral fissures, low-set ears, and thin upper lip. (I) Affected individual at 18 years of age. Individual displays high anterior hairline, ptosis, and down-slanting palpebral fissures. (J to L) Affected infant displays asymmetric crying facies, wide and flat nasal bridge, posteriorly rotated ears, as well as shoulder, hand, and elbow malformations. (M to P) Affected individuals display limb abnormalities including brachydactyly (M to O) and wrist contractures (P). |
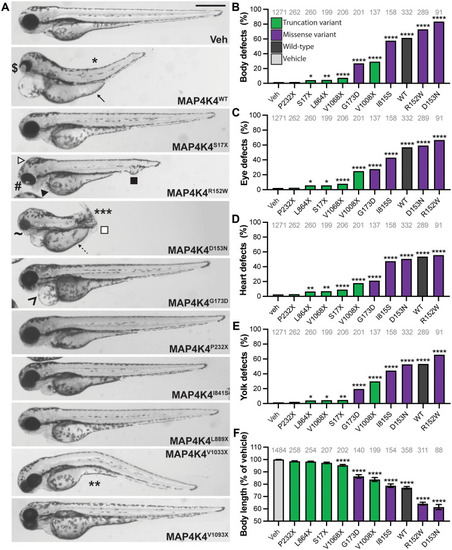
MAP4K4 variants cause LOF.
(A) Larvae microinjected with variant MAP4K4 were imaged at 3 days post fertilization (dpf); representative lateral views are shown. Ectopic expression of MAP4K4 caused developmental defects, including craniofacial anomalies (CFAs; closed arrowhead), hydrocephaly (white arrowhead), and cloacal defects (closed square). Larvae are arranged according to the position of the variant within the protein (top to bottom; N to C terminus). (B to E) Developmental defects were quantified as a percentage of total larvae displaying the defect. (B) Body defects included dorsal (*), ventral (**) and lateral (***) curvatures, and truncations (white square). (C) Eye defects included coloboma ($), cyclopia (#), and small eyes (~). (D) Heart defects included pericardial edema (^). (E) Yolk defects included thickening of the yolk extension (solid arrow) and absent yolk constriction (dashed arrow). (F) Body length was measured and normalized to the average of the vehicle-injected siblings (Veh) and is reduced by expression of MAP4K4WT and missense variants but is less affected by truncation variants. Scale bar, 500 μm (A). Graphs (B to F): pale gray, vehicle; dark gray, MAP4K4WT; purple, missense variants; and green, truncation variants. *P < 0.05; **P < 0.01; ***P < 0.001; ****P < 0.0001 by pairwise chi-square test (B to E) or Student’s t test (F) compared to vehicle. Analysis of variance (ANOVA) gives P < 0.0001 for (F). n numbers are inset to graphs in gray text. Error bars represent SEM. WT, wild type. |
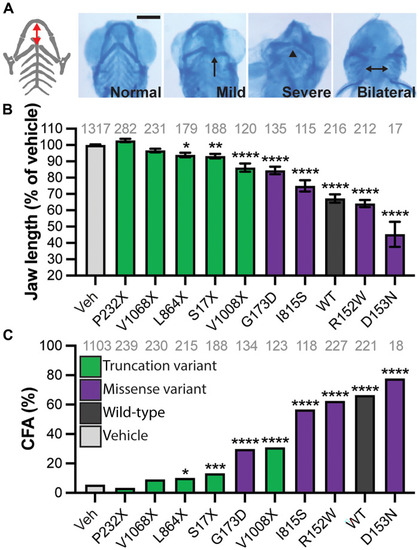
Ectopic MAP4K4 expression causes CFAs at 5 dpf.
(A) Representative ventral view of Alcian blue staining of jaw cartilage. Schematic of the cartilages shown in gray with the distance between the Meckel’s and ceratohyal cartilages shown by a red arrow. Malformations included misshapen cartilage (arrow), increased angle between ceratohyal cartilages (arrowhead), and bilateral positioning of cartilage (double-headed arrow). (B) Jaw length was measured and normalized to the average of the vehicle-injected siblings (Veh) and is reduced by expression of MAP4K4WT and missense variants. (C) The incidence of malformations was quantified as a percentage of total larvae showing a defect. Scale bar, 200 μm (A). Graphs (B to C): pale gray, vehicle; dark gray, MAP4K4WT; purple, missense variants; green, truncation variants. *P < 0.05; **P < 0.01; ***P < 0.001; ****P < 0.0001 by pairwise Student’s t test (B) or chi-square test (C) compared to vehicle. ANOVA gives P < 0.0001 for (B). n numbers are inset to graphs in gray text. Error bars represent the SEM. |
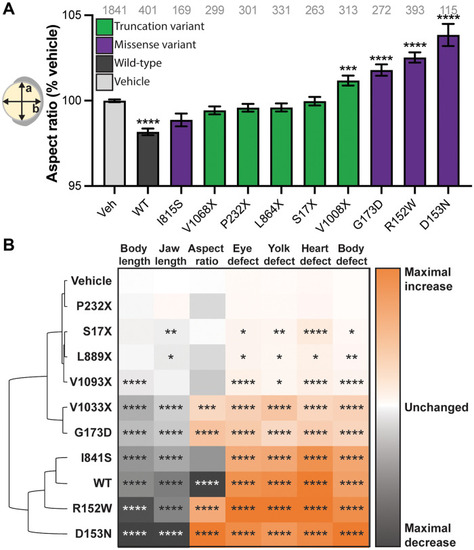
Increasing and decreasing MAP4K4 has similar effects on development.
(A) Aspect ratio was measured at 11 hours post fertilization (hpf) as the ratio of a divided by b, shown on the embryo schematic. WT and hypomorphic variants reduce the aspect ratio, loss-of-function (LOF) variants have no effect, and dominant-negative (DN) variants elongate the embryo. (B) Hierarchical clustering of the quantitative phenotypic metrics ranks DN alleles as closer to MAP4K4WT in phenotypic output than to loss of function alleles. The P value for each measurement is shown in the box, with the absence of symbols indicating nonsignificant changes. Graph: pale gray, vehicle; dark gray, MAP4K4WT; purple, missense variants; green, truncation variants. *P < 0.05; **P < 0.01; ***P < 0.001; ****P < 0.0001 by pairwise Student’s t test compared to vehicle. ANOVA gives P < 0.0001 for (A). n numbers are inset to graph in gray text. Error bars represent the SEM. |
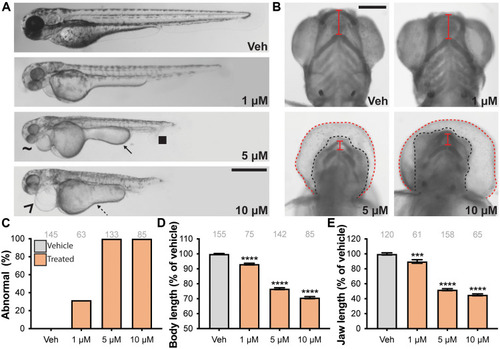
Pharmacological inhibition of Map4k4 impacts similar tissues to those affected in affected individuals.
(A and B) WT embryos were treated with different doses of the MAP4K4 inhibitor PF06260933. (A) At 3 dpf, Map4k4 inhibition induced developmental defects including shortening of the body, small eyes (~), cloacal defects (closed square), pericardial edema (^), and thickening of the yolk extension (arrow) or reduced yolk constriction (dashed arrow). Representative lateral images are shown. (B) Representative ventral images of Alcian blue staining of the jaw cartilage at 5 dpf. At higher doses, the swollen hearts obscure the jaw. For clarity, the black dashed line outlines the head, the red dashed line outlines edematous heart, and the solid red line indicates the distance between the ceratohyal and Meckel’s cartilages. (C to E) Quantitation of abnormalities (C), body length (D), and jaw length (E) reveals increasing defects and shortening of both body and jaw in a dose-responsive manner. Scale bars, 500 (A) and 200 μm (B). Graphs: pale gray: vehicle (Veh); orange, drug treated. *P < 0.05; **P < 0.01; ***P < 0.001; ****P < 0.0001 by pairwise Student’s t test (D and E) compared to vehicle. ANOVA gives P < 0.0001 for (D) and (E). n numbers are inset to graphs in gray text. Error bars represent the SEM. |

map4k4 ablation results in altered craniofacial patterning and cardiac phenotypes in zebrafish larvae.
(A) Representative ventral images show cartilage structures in the anterior region of -1.4col1a1:egfp zebrafish larvae at 3 dpf for control, morpholino (MO), and MO rescued with WT human MAP4K4 mRNA. Adjoining white dashed lines indicate the ceratohyal (CH) angle; vertical dashed line indicates the distance from Meckel’s cartilage (MK) to CH. CB, ceratobranchial arches. (B and C) Quantification of CH angle and CH to MK distance measurements on ventral green fluorescent protein–positive (GFP+) images acquired at 3 dpf [as shown in (A)]; n = 35 to 40 larvae per batch, repeated. (D) Representative ventral images of cardiac chambers of cmlc2:egfp zebrafish larvae at 2 dpf. (E and F) Quantification of atrium and ventricle area measured on ventral images at maximum diastole [as shown in (D)]; n = 38 to 45 larvae per batch, repeated. For (B), (C), (E), and (F), each condition is normalized to its respective experimental control and expressed as a percentage. Scale bars, 300 (A) and 200 μm (D). *P < 0.05; **P < 0.01; ***P < 0.001; ****P < 0.0001; n.s., not significant, by pairwise Student’s t test compared to vehicle. Error bars represent the SEM. PHENOTYPE:
|
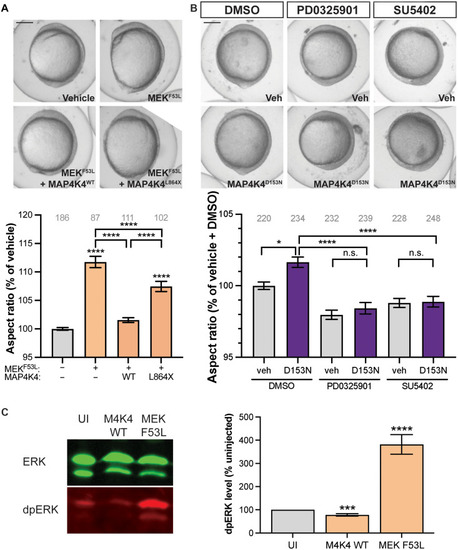
MAP4K4 is a negative regulator of RAS signaling.
(A) Embryos were injected with a hyperactive variant of MEK, MEKF53L, in combination with MAP4K4 variants. Embryos were imaged at 11 hpf, and the aspect ratio was calculated. MEKF53L increases aspect ratio, and this elongation is rescued by MAP4K4WT but not MAP4K4L889X. (B) Embryos were injected with MAP4K4D153N and then treated with an inhibitor of MAPK kinase (MEK), PD0325901, or the fibroblast growth factor receptor (FGFR), SU5402. Embryos were imaged at 11 hpf, and the aspect ratio was calculated. Inhibiting ligand binding or MEK activity rescues the elongation caused by MAP4K4D153N. DMSO, dimethyl sulfoxide. (C) Western blotting with quantification and normalization of the level of dually phosphorylated extracellular signal–regulated kinase (dpERK) to the amount of total ERK. Scale bars, 250 μm (A and B). Graph (A): pale gray, vehicle (Veh); orange, drug treated. Graph (B): pale gray, vehicle; purple, MAP4K4D153N. *P < 0.05; **P < 0.01; ***P < 0.001; ****P < 0.0001 by pairwise Student’s t test compared to vehicle. ANOVA gives P < 0.0001 for (A) and (B). n numbers are inset to graphs in gray text. Error bars represent the SEM. |