
- Title
-
pyHeart4Fish: Chamber-specific heart phenotype quantification of zebrafish in high-content screens
- Authors
- Vedder, V.L., Reinberger, T., Haider, S.M.I., Eichelmann, L., Odenthal, N., Abdelilah-Seyfried, S., Aherrahrou, Z., Breuer, M., Erdmann, J.
- Source
- Full text @ Front Cell Dev Biol

Overview of primary screening (A) High-content screening results for z-normalized heart rate data, obtained by analysis with HeartBeat software (v.2.1). Z-scores above or below ±1.96 are considered significant with a 95% CI. For the primary screen, effect sizes of a 90% CI (±1.64) were considered to reduce false-negative results. The center pie-chart shows the therapeutic classes of the 134 hits (90% CI). The therapeutic classes of the remaining 31 hits after filter application is shown on the right. (B) The structure of selected hit compounds with cardioactive properties. Class = therapeutic class; CNS = central nervous system; EMA = European Medicines Agency; FDA = Food and Drug Administration; HCl = Hydrochloride; OTC = over-the-counter drug; anatomical therapeutic chemical (ATC) classification are displayed (indicated by #) if available. |
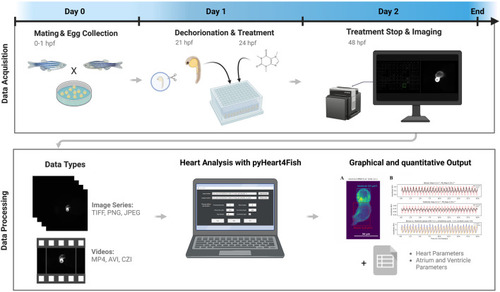
Screening and data analysis workflow. Eggs were collected after 1 h of pair- or group-wise mating before being incubated overnight. At 21 h post-fertilization (hpf), embryos were dechorionated, then at 24 hpf were treated with compounds from the Prestwick drug library. Treatment was stopped at 48 hpf, and fish were mounted in orientation plates to visualize fluorescent hearts and imaged with an ACQUIFER imaging machine. Displayed data types can be quantified using the pyHeart4Fish GUI and result in a graphical output in the form of GIFs and PNGs, as well as data sheets with additional meta and quantitative data. This figure was created with BioRender.com. |

pyHeart4Fish validation and interpretation guide (A) Pearson correlation analysis for manual and semi-automated heart rate measurements in atrium and ventricle using pyHeart4Fish (pyH4F) vs. manual determination (50 zebrafish), user-dependent determination (85 zebrafish), and pairwise comparison of replicates (561 zebrafish, 2–13 replications). Outliers (shown in gray) with more than 3-fold y standard deviation from the regression curve were not considered when calculating the Pearson correlation coefficient. (B) An interpretation guide for max. dilation and max. contraction data obtained with pyHeart4Fish. The smallest circles indicate max. contraction and circles larger than these indicate dilation. Blue represents controls and orange represents treated hearts. The arrows indicate the difference between min. and max. chamber size in treated fish. The displayed examples demonstrate increased max. dilation with decreased max. contraction after opipramol diHCl exposure, and reduced max. dilation and contraction in the atrium of benzydamine HCl-treated embryos (C) A representative raw data output of pyHeart4Fish analysis. The overlay of raw-signal in combination with the arrhythmia score, and conduction score shows there are no conduction defects between the atrium and ventricle in opipramol diHCl- and benzydamine HCl-treated embryos. Black line = raw signal; red dotted line = fitted sine function; freq = frequency estimated using the sine function; fft_freq = fast fourier transformation frequency; HCl = hydrochloride. |

Quantitative data analysis with pyHeart4Fish. Analysis of treated fish with pyHeart4Fish revealed multiple functional heart phenotypes. (A) The left graph presents the detected heart rate derived from the fast fourier transformation (FFT). The right graph displays the approximate heart size in µm2. (B) Percentual data on the severity of manually assessed pericardial edema in treated Tg(myl7:eGPF)twu34/+ zebrafish. (C) The relative contractility derived from percentual size changes of each heart chamber (left graph). Approximate ejection fraction determined by chamber volume changes (right graph). (D) Mean max. heart chamber size (dilation) is presented on the left, while the mean min. heart chamber size (max. contraction) is displayed on the right. The number of fish analyzed is shown in brackets after the treatment condition. Dotted gray lines indicate z-scores of ±1.96 and statistical significance with an alpha error of 5%. |

Morphology of treated zebrafish 2 dpf. An overview of the gross phenotypes of treated zebrafish 2 days post-fertilization. All compounds were dissolved in DMSO; therefore, DMSO served as the negative control. NaCl served as the salt control. The effects of atorvastatin treatment on zebrafish embryos were previously established; thus, this drug was used as a positive control for cardioactivity. The aquatic toxic compound enilconazole was used as the toxic positive control. Heart morphology was drastically affected only by enilconazole, cycloheximide, and pregnenolone. The black arrow in the image of iopanoic acid-treated zebrafish embryo indicates caudal fin deformity. The scale bar indicates 500 µm in overview brightfield images and 150 µm in fluorescence images. (a) Atrium; (v) ventricle. |
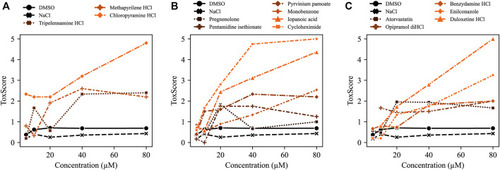
ToxScores of increasing compound concentrations. The compounds concentration-dependently increased ToxScores in treated zebrafish embryos. The ToxScores of (A) three HRH1 antagonists, (B) various compounds, and (C) hydrochlorides (HCls). The color gradient indicates the severity of the ToxScore from black (low ToxScore) to orange (high ToxScore). |