
- Title
-
An arginase 2 promoter transgenic illuminates immune cell polarisation in zebrafish
- Authors
- Hammond, F.R., Lewis, A., Speirs, Z.C., Anderson, H.E., Sipka, T., Williams, L.G., Nguyen-Chi, M., Meijer, A.H., Wiegertjes, G.F., Elks, P.M.
- Source
- Full text @ Dis. Model. Mech.

The TgBAC(arg2:eGFP)sh571 line shows GFP expression in ionocytes but not in resting macrophages and neutrophils, recapitulating the arg2 in situ hybridisation expression pattern. (A,B) Light-sheet microscopy stereo micrographs of the TgBAC(arg2:eGFP)sh571 (arg2:GFP) line shows ionocyte-specific expression at 2 dpf (A) and 3 dpf (B). (C) Enlarged image of the section over the yolk of B. (D) arg2 in situ hybridisation shows expression in cells over the yolk known as ionocytes at 2 and 3 dpf in unchallenged zebrafish (n=15/15 larvae accumulation over three independent experiments). (E) Enlarged image of the section over the yolk of 3 dpf larvae in D. (F) Stereo fluorescence micrograph of the arg2:GFP line crossed to the Tg(mpeg1:mCherry)sh378 (mpeg:mCherry) line at 2, 3, 4 and 5 dpf, showing no overlap of arg2:GFP expression in ionocytes with mpeg:mCherry-positive (magenta) macrophages. Sixty larvae in total were screened for macrophage-specific arg2:GFP expression over three independent experiments. (G) Stereo fluorescence micrograph of the arg2:GFP line crossed to the Tg(lyz:nfsB.mCherry)sh260 (lyz:mCherry) line at 2, 3, 4 and 5 dpf, showing no overlap of arg2:GFP expression in ionocytes with lyz:mCherry-positive (magenta) neutrophils. Sixty larvae in total were screened for neutrophil arg2:GFP expression over three independent experiments. |
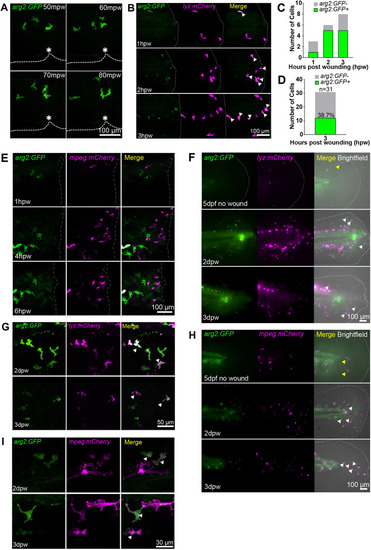
Neutrophils express arg2:GFP after wound challenge. (A) Fluorescence confocal timelapse micrographs of arg2:GFP-positive cells migrating towards a tailfin nick wound performed at 3 dpf at early timepoints post injury. Dashed lines indicate the edge of the fin and the asterisks mark the nick wound. mpw, minutes post wound. (B) Fluorescence confocal micrographs of the arg2:GFP line crossed to the lyz:mCherry line showing overlap of arg2:GFP with neutrophils at a tailfin wound performed at 3 dpf (dashed-dotted lines). Arrowheads indicate arg2:GFP-positive neutrophils migrating at the wound. Example timelapse images from two independent experiments with six larvae were imaged. (C) Quantification of arg2:GFP-positive neutrophils from B. (D) Number of neutrophils at the wound site that were arg2:GFP positive at 3 hpw. n=6 larvae combined from two independent experiments. (E) Fluorescence confocal timelapse micrographs of the arg2:GFP line crossed to the mpeg:mCherry line showing no overlap of macrophages with arg2:GFP expression early after injury performed at 3 dpf (dashed-dotted lines indicate the wound). The high exposure of the green channel to detect the earliest signs of arg2:GFP expression means that the autofluorescence of pigment cells is also evident, but these do not colocalise with mpeg:mCherry-positive cells. Sixty larvae in total were screened for macrophage arg2:GFP expression over three independent experiments. (F) Fluorescence widefield micrographs of the arg2:GFP line crossed to the lyz:mCherry line. The upper panels show an uninjured tailfin with few neutrophils (yellow arrowhead) and no immune cell-specific arg2:GFP expression overlap at 5 dpf. The middle panels show an injured tailfin (injury performed at 2 dpf) at 2 dpw (4 dpf) showing overlap between lyz:mCherry and arg2:GFP expression (white arrowheads). The lower panels show an injured tailfin at 3 dpw (5 dpf) showing overlap between lyz:mCherry and arg2:GFP expression (white arrowheads). The dashed-dotted lines indicate the edge of the tailfin fold. (G) Fluorescence confocal micrographs of the arg2:GFP line crossed to the lyz:mCherry line at 2 dpw (upper panels) and 3 dpw (lower panels), showing examples of lyz:mCherry-positive arg2:GFP-expressing cells (arrowheads) in the proximity of the healing tailfin wound performed at 2 dpf. (H) Fluorescence widefield micrographs of the arg2:GFP line crossed to the mpeg:mCherry line. The upper panels show an uninjured tailfin with few macrophages (yellow arrowheads) and no immune cell-specific arg2:GFP expression at 5 dpf. The middle panels show an injured tailfin (injury performed at 2 dpf) at 2 dpw (4 dpf) showing no overlap between mpeg:mCherry and arg2:GFP expression. mpeg:mCherry-negative cells expressing arg2:GFP with an amoeboid immune cell shape are shown by white arrowheads. The lower panels show an injured tailfin at 3 dpw (5 dpf) showing no overlap between mpeg:mCherry and arg2:GFP expression, with mpeg:mCherry-negative cells expressing arg2:GFP with an amoeboid immune cell shape shown by white arrowheads. The dashed-dotted lines indicate the edge of the tailfin fold. (I) Fluorescence confocal micrographs of the arg2:GFP line crossed to the mpeg:mCherry line at 2 dpw (upper panels) and 3 dpw (lower panels), showing examples of mpeg:mCherry-positive arg2:GFP-expressing cells in the proximity of the healing tailfin wound (injury performed at 2 dpf) (arrowheads). |

Neutrophils are the predominant immune cell that express arg2:GFP post Mm challenge. (A) Fluorescence confocal micrographs of 1 dpi (2 dpf) embryos (arg2:GFP line crossed to the lyz:mCherry line) after PVP mock infection at 1 dpf. (B) Fluorescence confocal micrographs of 1 dpi (2 dpf) embryos (arg2:GFP line crossed to the lyz:mCherry line) after Mm infection at 1 dpf showing GFP-positive neutrophils (filled arrowheads) and GFP-negative neutrophils (hollow arrowhead) around an area of high infection (asterisk). (C) Fluorescence confocal micrographs of 1 dpi (2 dpf) embryos (arg2:GFP line crossed to the lyz:mCherry line after Mm infection at 1 dpf showing that both infected (filled arrowhead) and non-infected (hollow arrowhead) neutrophils can express arg2:GFP. n=15 larvae imaged over three independent experiments. (D) Graph showing the number of arg2:GFP-positive and -negative neutrophils in a 40× region of interest in the caudal vein region that contained Mm bacteria, post infection, in individual larvae. Data shown are from n=15 larvae accumulated from three independent experiments. (E) Corrected fluorescence intensity of arg2:GFP expression in lyz:mCherry-positive neutrophils compared to that of cells with an immune morphology that were lyz:mCherry negative at 1 dpi (2 dpf). Data shown are from n=9 larvae accumulated from three independent experiments. P-values were calculated using unpaired two-tailed t-test. **P<0.01. (F) Fluorescence confocal micrographs of 1 dpi (2 dpf) embryos (arg2:GFP line crossed to the mpeg:mCherry line) after PVP control injection at 1 dpf. (G) Fluorescence confocal micrographs of 1 dpi (2 dpf) embryos (arg2:GFP line crossed to mpeg:mCherry line) after Mm infection at 1 dpf showing a single GFP-positive macrophage (filled arrowhead) in this field of view (representing one of six instances observed). (H) Graph showing the number of arg2:GFP-positive and -negative macrophages in a 40× region of interest in the caudal vein region that contained Mm bacteria post infection in individual larvae. (I) Graph showing the percentage of arg2:GFP-positive and -negative neutrophils and macrophages in a 40× region of interest around the infected caudal vein region. Data shown are from n=98-123 cells accumulated from 15 larvae for neutrophils and 13 larvae for macrophages over three independent experiments. |
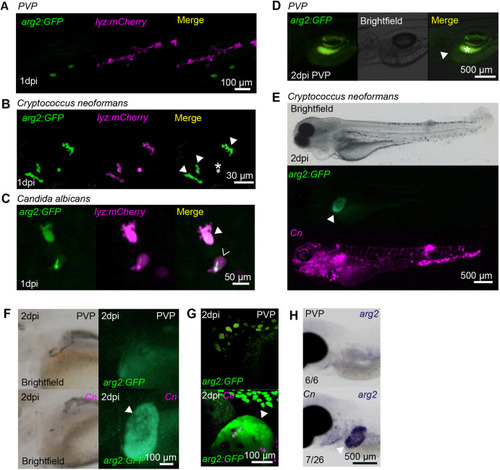
Fungal infections upregulate arg2:GFP expression in neutrophils and the liver. (A) Fluorescence confocal micrographs of 2 dpf embryos (arg2:GFP line crossed to the lyz:mCherry line) after PVP mock infection at 1 dpi showing no overlap between GFP and lyz:mCherry expression. (B) Fluorescence confocal micrographs of 1 dpi (2 dpf) embryos (arg2:GFP line crossed to the lyz:mCherry line) after Cryptococcus neoformans infection at 1 dpf showing GFP-positive neutrophils (filled arrowheads). The asterisk indicates a Cryptococcus that has autofluorescence in both channels. (C) Fluorescence confocal micrographs of 1 dpi (2 dpf) embryos (arg2:GFP line crossed to the lyz:mCherry line) after Candida albicans infection at 1 dpf showing a GFP-positive neutrophil (filled arrowhead) and a GFP-negative neutrophil (hollow arrowhead (the green fluorescence signal in this cell is autofluorescence from Candida, which in this instance has survived and formed a hypha). (D) Brightfield and fluorescence micrographs of arg2:GFP larvae at 2 dpi (3 dpf) after PVP injection at 1 dpf. The position of the arg2:GFP-negative liver is shown by the arrowhead. The contrast of the green fluorescence channel has been turned up sufficiently to show gut fluorescence (asterisk), in order to show that the liver is arg2:GFP negative. (E) Brightfield and fluorescence micrographs of 2 dpi (3 dpf) arg2:GFP larvae after Cryptococcus neoformans (Cn) infection at 1 dpf showing arg2:GFP liver-specific expression in an individual with high levels of infection. (F) Brightfield and widefield fluorescence micrographs of 2 dpi (3 dpf) arg2:GFP larvae after PVP mock infection or Cn infection at 1 dpf, showing arg2:GFP liver-specific expression (arrowhead) in the Cn-infected individual. (G) Fluorescence confocal micrographs of 2 dpi (3 dpf) arg2:GFP larvae after PVP mock infection or Cn infection at 1 dpf showing arg2:GFP liver-specific expression (arrowhead) in the Cn-infected individual (arrowhead). (H) Brightfield stereo micrographs of 2 dpi (3 dpf) embryos after PVP or Cn infection at 1 dpf and arg2 whole-mount in situ hybridisation at 3 dpf showing arg2 liver-specific expression (arrowhead) in an infected individual, not present in the PVP-injected larvae. Liver-specific expression of arg2 was observed in n=7/26 Cn-infected larvae performed over three independent experiments. |
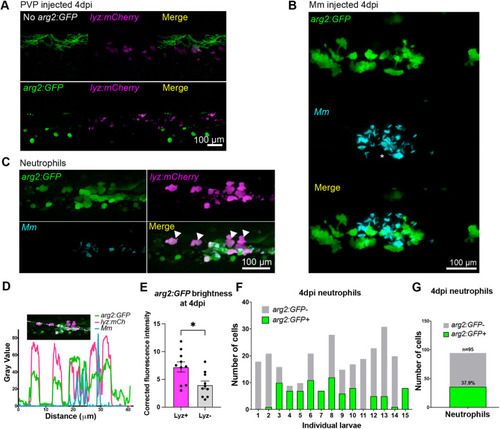
Granuloma-associated neutrophils express arg2:GFP. (A) Fluorescence confocal micrographs of 4 dpi (5 dpf) embryos [lyz:mCherry line crossed to the wild-type line (no arg2:GFP) or arg2:GFP line] after PVP control injection at 1 dpf. Only pigment autofluorescence and ionocyte-specific expression of arg2:GFP is present. (B) Fluorescence confocal micrographs of 4 dpi (5 dpf) arg2:GFP embryos after Mm infection at 1 dpf showing granuloma-associated arg2:GFP-positive cells. (C) Fluorescence confocal micrographs of 4 dpi (5 dpf) embryos (arg2:GFP line crossed to the lyz:mCherry line) after Mm infection at 1 dpf, showing neutrophils positive for arg2:GFP (filled arrowheads). (D) Line analysis of a cross section through a granuloma showing fluorescence values of arg2:GFP, lyz:mCherry and Mm. (E) Corrected fluorescence intensity of arg2:GFP in lyz:mCherry-positive neutrophils compared to that in cells with immune morphology that were lyz:mCherry negative at 4 dpi (5 dpf). Data shown are from n=10 larvae accumulated from three independent experiments. The P-value was calculated using unpaired two-tailed t-test. *P<0.05. (F) Graph showing the number of arg2:GFP-positive and -negative neutrophils in a 40× region of interest in the caudal vein region that contained Mm bacteria, at 4 dpi (5 dpf), in individual larvae. Data shown are from n=15 larvae accumulated from three independent experiments. (G) Graph showing the percentage of arg2:GFP-positive and -negative granuloma-associated neutrophils at 4 dpi (5 dpf). Data shown are from n=95 cells from 15 larvae accumulated over three independent experiments. |

A subset of granuloma-associated macrophages express arg2:GFP. (A) Fluorescence confocal micrographs of 4 dpi (5 dpf) embryos [mpeg:mCherry line crossed to the wild-type line (no arg2:GFP) or arg2:GFP line] after PVP control injection at 1 dpf. Only pigment autofluorescence and ionocyte-specific expression of arg2:GFP is present. (B) Fluorescence confocal micrographs of 4 dpi (5 dpf) embryos (arg2:GFP line crossed to the mpeg:mCherry line) after Mm infection at 1 dpf. (C) Graphs showing the percentage of arg2:GFP-positive and -negative granuloma-associated macrophages at 4 dpi (5 dpf). Data shown are from n=126 cells from 15 larvae accumulated from three independent experiments. (D) Corrected fluorescence intensity of arg2:GFP in mpeg:mCherry-positive macrophages compared to that in cells with immune morphology that were mpeg:mCherry negative at 4 dpi (5 dpf). Data shown are from n=12 larvae accumulated from three independent experiments. The P-value was calculated using unpaired two-tailed t-test. *P<0.05. (E) Fluorescence confocal micrographs of 4 dpi (5 dpf) embryos (arg2:GFP line crossed to the mpeg:mCherry line) after Mm infection at 1 dpf showing a non-infected, arg2:GFP-positive macrophage (arrowhead). (F) Fluorescence confocal micrographs of 4 dpi (5 dpf) embryos (arg2:GFP line crossed to the mpeg:mCherry line) after Mm infection at 1 dpf showing an infected, arg2:GFP-positive macrophage (arrowhead). (G) Corrected fluorescence intensity of mCherry in mpeg:mCherry-positive macrophages at 2, 3 and 4 dpi (3, 4 and 5 dpf, respectively) after Mm infection at 1 dpf. Data shown are from n=10-12 larvae. The P-value calculated using a one-way ANOVA (with Bonferonni post-test adjustment). ns, not significant. (H) Graph showing the percentage of arg2:GFP-positive and -negative granuloma-associated macrophages marked with Tg(fms:Gal4.VP16)i186;Tg(UAS:nfsB.mCherry)i149 (fms:mCherry) expression, at 4 dpi (5 dpf). Data shown are from n=33 cells accumulated from two independent experiments. (I) Fluorescence confocal micrographs of 4 dpi (5 dpf) embryos (arg2:GFP line crossed to the fms:mCherry line) after Mm infection at 1 dpf, showing an arg2:GFP-positive macrophage (arrowhead). |