
- Title
-
Phase Retrieval-Based Phase-Contrast Imaging and CT of Living Zebrafish
- Authors
- Tang, R., Chen, Y., Yan, F., Chen, K.M.
- Source
- Full text @ Zebrafish
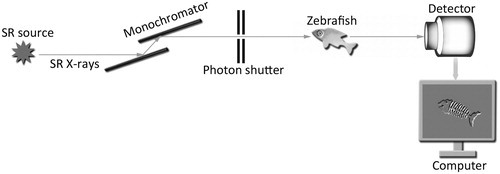
Schematic of the experimental setup. Prefiltered SR X-rays were monochromatized by a double-crystal monochromator. A detector captured the light and converted it into a signal that formed an image on the computer. |
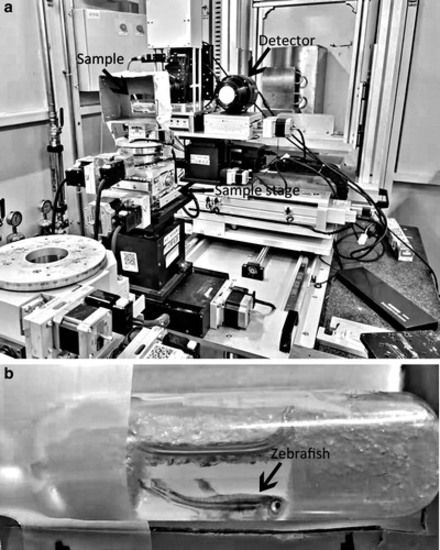
Position of the swimming zebrafish. (b) Is the magnified image of the region in the dotted box in (a). Zebrafish was placed in water in a polyethylene tube that was perpendicular to the SR beam. |
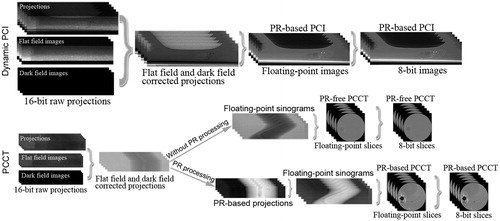
. PR processing using PITRE software. The 16-bit raw projections were corrected to remove their background noise. For PR-based PCI, PR processing was performed to get the PR-based floating-point images. For PR-based PCCT, PR processing was performed to get PR-based projections before the gaining of the sinograms. The floating-point sinograms were then reconstructed into floating-point slices. Finally, the floating-point images or slices were converted to 8-bit. PCCT, phase-contrast CT; PCI, phase-contrast imaging; PITRE, Phase-sensitive X-ray Image processing and Tomography REconstruction; PR, phase retrieval. |
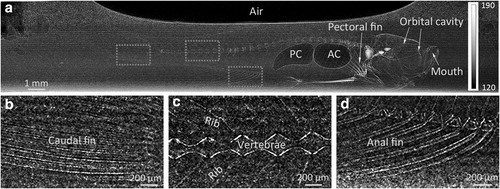
PR-based PCI of the swimming zebrafish. (b–d) are magnified images of the corresponding regions in the dotted boxes in (a). The skeleton and the air-filled chambers were clearly shown. The adjusted gray value scaling is given on the right of (a). The 8-bit images had a gray value scaling from 0 to 255. AC, anterior chamber; PC, posterior chamber. |
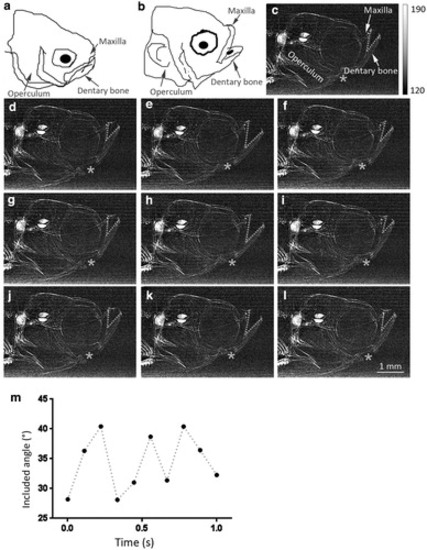
Dynamic PR-based PCI of zebrafish facial breathing movement in 1 s. (a, b) Are diagrams of zebrafish closing and opening its mouth, respectively. (c–l) Real-time visualization of the coordinated displacement of facial structures during the breathing. Note that the included angle between the maxilla and dentary bone (dotted angles) and the space between the operculum and dentary bone (stars) increased and decreased periodically. (m) Time course of the included angle between the maxilla and dentary bone. The adjusted gray value scaling is given on the right of (c). The 8-bit images had an original gray value scaling from 0 to 255. |

Dynamic PR-based PCI of the swimming zebrafish. Column 1 shows the dorsal view diagrams. Column 2 shows the X-ray lateral view of the swimming zebrafish. The dynamic process of twisting the body and swinging the fins to make turns during swimming was clearly shown. The adjusted gray value scaling is given on the right of the first image. The 8-bit images had an original gray value scaling from 0 to 255. |

Comparison of the soft tissue visibility between PR-free PCCT and PR-based PCCT for living zebrafish. (a) Anesthetized zebrafish was placed in water and fixed by sponge in a plastic tube. (b) Projection image of a part of the zebrafish body. (c–d) Are axial PR-free PCCT image and PR-based PCCT image, respectively, at the level marked by the dotted line in (b). The adjusted gray value scalings are given on the right. Line profile analyses along the dotted lines are displayed. Note that PR processing enabled more contrast difference between adipose tissue and muscle tissue. Posterior chamber was definitely shown on both PR-free PCCT and PR-based PCCT images. (e–h) Are magnified images of the regions in the dotted boxes shown in (c, d), respectively. Note that the vertebra was clearly shown on the PR-free PCCT image (e), whereas the apparent thickness of the vertebra increased on the PR-based PCCT image with soft-tissue gray value scaling (g). The adipose tissue and muscle tissue were more visible on the PR-based PCCT image (h) than on the PR-free PCCT image (f). AT, adipose tissue; MT, muscle tissue. |
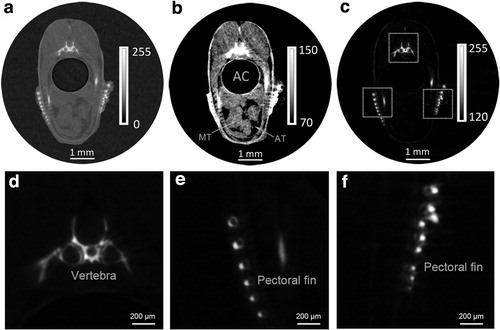
PR-based PCCT with different gray value scalings. (a) Is the original generated 8-bit image, with a gray value scaling of 0 to 255. (b) Is the image for showing soft tissues, with a gray value scaling of 70 to 150. Adipose tissue and muscle tissue were clearly shown. (c) Is the image for showing the bones, with a gray value scaling of 120 to 255. (d–f) Are magnified images of the regions in the dotted boxes shown in (c). Note that the vertebra and pectoral fin were clearly shown with appropriate gray value scaling. |
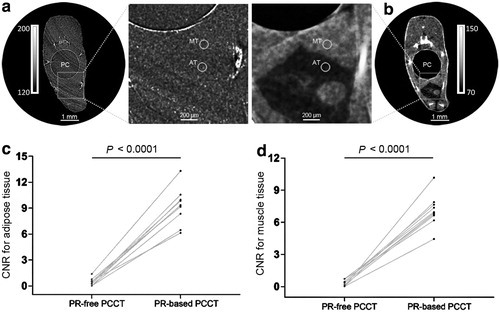
Comparison of the soft tissue CNRs between PR-free PCCT and PR-based PCCT. (a, b) Are PR-free PCCT and PR-based PCCT images, respectively. Note that the adipose tissue and muscle tissue were more clearly shown on the PR-based PCCT image than on the PR-free PCCT image. The mean intensities and SDs in two ROIs with a diameter of 100 μm (dotted circles) were measured for adipose tissue and muscle tissue, respectively. The adjusted gray value scalings are given. The CNRs from PR-based PCCT were significantly higher than those from PR-free PCCT for both adipose tissue (c) and muscle tissue (d). CNRs, contrast-to-noise ratio; ROIs, region of interest; SDs, standard deviation. |