
- Title
-
Unexpected phenotypic and molecular changes of combined glucocerebrosidase and acid sphingomyelinase deficiency
- Authors
- Keatinge, M., Gegg, M.E., Watson, L., Mortiboys, H., Li, N., Dunning, M., Ailani, D., Bui, H., van Rens, A., Lefeber, D.J., Schapira, A.H.V., MacDonald, R.B., Bandmann, O.
- Source
- Full text @ Dis. Model. Mech.

Representative image of the ceramide pathway. The enzymes involved in the ceramide pathway under study (GBA1 and SMPD1) are highlighted in red; enzymes marked with asterisks are linked to PD. |
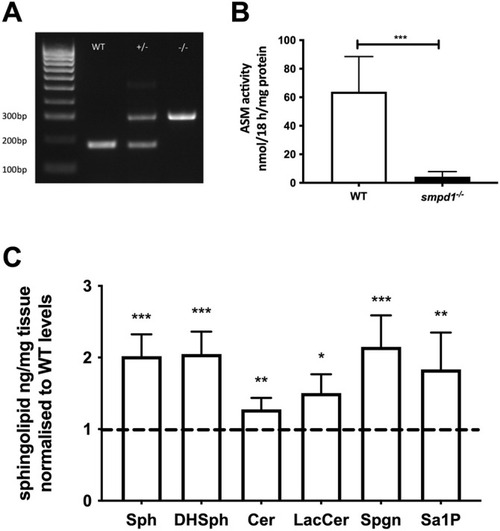
Genetic and biochemical characterisation of the smpd1−/− mutant zebrafish line. (A) Representative genotyping gel of the smpd1−/− alleles (5 bp deletion and 136 bp insertion) demonstrating WT, smpd1+/− and smpd1−/−. (B) Acid sphingomyelinase (ASM) enzymatic activity in smpd1−/− compared to WT controls (n=6 larvae at 5 dpf per genotype, P=0.006 by two-tailed unpaired Welch's t-test). (C) Quantification of sphingolipid metabolites, namely, sphingomyelin (Sph), dihydro-sphingomyelin (DHSph), ceramide (Cer), lactosylceramide (LacCer), sphinganine (Spgn) and sphinganine 1 phosphate (Sa1P). All metabolites shown are the C18 neuronal species. Data represented are the mean±s.d. *P<0.05; **P<0.01; ***P<0.001 (two-tailed unpaired t-test). PHENOTYPE:
|
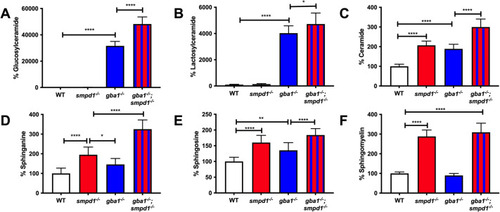
Accumulation of key glycolipids across gba1−/− and smpd1−/− single-mutant and gba1−/−;smpd1−/− double-mutant genotypes. Relative glucosylceramide (A), lactosylceramide (B), ceramide (C), sphinganine (D), sphingosine (E) and sphingomyelin (F) levels in WT, single-mutant gba1−/− and smpd1−/−, and double-mutant gba1−/−;smpd1−/− zebrafish. n=10 brains from 12-week-old zebrafish used per group. Data represented are the mean±s.d. *P<0.05; **P<0.01; ****P<0.0001 (two-way ANOVA with Tukey's multiple comparisons). |
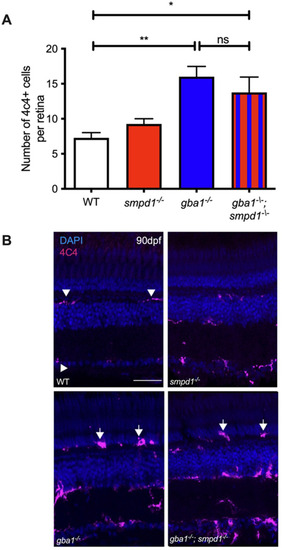
Gaucher cell accumulation in the retina of gba1−/−;smpd1−/− double mutants. (A) Analysis of the numbers of 4C4-positive cells within the retina revealed comparatively significant increases of ∼50% in both gba1−/− (P=0.0026) and gba1−/−;smpd1−/− mutants (P=0.0193) compared to those in WT, despite enhancement of key glycolipid levels in the double mutants. 4C4-positive cell counts in smpd1−/− were not statistically different to those in WT. Data represented are the mean±s.d. *P<0.05; **P<0.01 (two-way ANOVA). n= 4 for all groups. (B) 4C4-positive cells in the retina of the gba1−/− and gba1−/−;smpd1−/− double mutants were localised throughout the retina and appeared larger and rounder (arrows) compared to ramified WT 4C4-positive cells (arrowheads). Scale bar: 50 μm. |
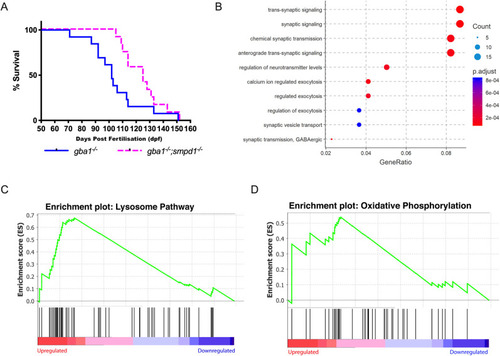
ASM deficiency improves survival and rescues neuronal dysfunction in gba1−/− zebrafish. (A) Disease-free survival analysis of gba1−/−;smpd1−/− double-mutant (n=13) compared to gba1−/− single-mutant (n=12) zebrafish. P=0.0055 by Gehan–Breslow–Wilcoxon test. Animals were culled for humane reasons when they could no longer consistently maintain buoyancy. (B) The Comparative GO analysis indicates marked global impairment of neuronal function in gba1−/− but restoration of neuronal health in gba1−/−;smpd1−/− . A differential expression analysis was first used to identify genes with statistically significant difference between gba1−/− and gba1−/−;smpd1−/−. Genes with adjusted P-value<0.05 and log2(fold change) >1 or <−1 were used to identify enriched biological processes amongst genes that were over- and under-expressed in gba1−/−. ClusterProfiler identified significantly enriched GO terms within the gene expression changes, which were plotted by GeneRatio (ratio of the differentially expressed genes with one particular GO term to the total number of differentially expressed genes). The lists of over- and under-expressed genes were analysed separately. Shown are the ten GO terms with highest gene ratios amongst under-expressed genes, all relating to key aspects of normal neuronal function and homeostasis. The pathways downregulated in gba1−/− compared to WT were normalised in the double mutants. Each GO term is coloured according to the adjusted P-value and ranked according to gene ratio. The size of the point is then scaled according to the number of differentially expressed genes with the GO term. (C,D) Lysosomal pathway genes and oxidative phosphorylation pathway genes are upregulated in gba1−/− but normalised in gba1−/−;smpd1−/−. The comparison of RNAseq-based transcription levels in the respective pathways between gba1−/− and gba1−/−;smpd1−/− revealed that both lysosomal pathway genes (C) and oxidative phosphorylation pathway genes (D) were enriched with marked upregulation of both pathways in gba1−/− compared to WT and gba1−/−;smpd1−/−. The x-axis ranks all differentially expressed genes based on the rank metric score from the most upregulated (left) to the most downregulated (right) for either pathway. The vertical black lines show the location of pathway genes in the entire ranked list from the gba1−/− expression changes, compared to WT and double mutants. The y-axis is the degree to which a set of pathway genes is overrepresented at the extremes (up- or downregulated) of the entire ranked list of all differentially expressed genes within the genome. A peak in enrichment score (green line) demonstrates an enrichment of pathway genes amongst all over- or under-represented genes. A sharp peak demonstrates how highly upregulated each pathway is within the gba1−/− group compared to WT and double mutants. PHENOTYPE:
|

Mitochondrial respiratory chain function and lipid peroxidation. (A) Complex I activity was reduced in smpd1−/− by 64±34.77% (mean±s.d.) compared to that in WT (P=0.0198). Complex I activity was normalised in gba1−/−;smpd1−/− with an increase of 56±21.9% compared to that in smpd1−/− (P=0.0445). (B) Complex II activity was similar across the different genotypes (P>0.05). (C) Complex III activity was reduced in gba1−/− compared to that in WT by 45±14.99% (P=0.0091) and increased by 35±35.2% in gba1−/−;smpd1−/− compared to that in gba1−/−, but this did not reach significance (P>0.05). (D) Complex IV activity was reduced in gba1−/− by 40±26.79% compared to that in WT (P=0.0491), but completely rescued in gba1−/−;smpd1−/− double mutants with an increase of 69±26.79% compared to that in gba1−/− (P=0.0005). For all mitochondrial complex activity measurements, six brains were used for each genotype. (E) Mitochondrial lipid peroxidation levels were increased by 63±51% in gba1−/− compared to those in WT (P=0.0214), but reduced by 71±43.48% compared to those in gba1−/− and thus effectively normalised to WT levels in gba1−/−;smpd1−/− double mutants (P=0.0094). For lipid peroxidation experiments, n=6-8 zebrafish bodies were used for each genotype. Significance in both mitochondrial respiratory chain assays and analyses of lipid peroxidation levels was determined by two-way ANOVA with Tukey's multiple comparison test using 12-week-old brain material. Data represented are the mean±s.d. ns, not significant; *P<0.05; **P<0.01; ***P<0.001. |