
- Title
-
Temporally and regionally distinct morphogenetic processes govern zebrafish caudal fin blood vessel network expansion
- Authors
- Leonard, E.V., Hasan, S.S., Siekmann, A.F.
- Source
- Full text @ Development

Branching morphogenesis of zebrafish caudal fin vasculature. (A) Time course of the study from 3 dpf to 4 wpf (3 mm standard length to 8 mm standard length). (B-F) Maximum intensity projections of confocal z-stacks of Tg(-0.8flt1:RFP)hu5333; Tg(flt4:citrine)hu7135 double-transgenic animals labelling arterial ECs (red) and venous ECs (white). Lengths for indicated timepoints are the average from 10 larvae. (B) Posterior circulatory loop (PCL) at 3 dpf. Scale bar: 50 μm. (B′) Area outlined in B showing anastomosis of a newly formed sprout with the dorsal aorta (DA) (yellow dashed lines). Scale bar: 20 μm. (C) First ventral sprout at 1 wpf. Bracket marks posterior axial vessels. Scale bar: 15 μm. (D) Vascular expansion at 2 wpf. Scale bar: 20 μm. (E) Alignment of arteries and veins at 3 wpf. Scale bar: 40 μm. (E′) Area outlined in E showing a two-vessel pattern (artery, main vein). Scale bar: 10 μm. (F,F′) Three-vessel pattern at 4 wpf. Scale bar: 80 μm. (F′) Area outlined in F showing caudal fin vasculature displaying a three-vessel pattern (main vein, artery and ancillary vein). Scale bar: 10 μm. (G-K) Maximum intensity projections of confocal z-stacks of Tg(-0.8flt1:RFP)hu5333; TgBAC(cxcr4a:YFP)mu104 double-transgenic animals. (G) Posterior circulatory loop (PCL) at 3 dpf (3 mm standard length). Scale bar: 10 μm. (G′) Area outlined in G showing anastomosis of a newly formed sprout with the dorsal aorta (DA). Scale bar: 5 μm. (H) Sprout extending into the fin fold at 1 wpf (4 mm standard length). Scale bar: 15 μm. (I) Expansion of the vascular tree at 2 wpf (5.2 mm standard length). Scale bar: 20 μm. (I′) Area outlined in I showing overlap of cxcr4a and flt1 expression. Scale bar: 10 μm. (J) Developing arteries at 3 wpf (6 mm standard length). Scale bar: 30 μm. (J′) Area outlined in J showing two-vessel pattern (artery and main vein). Scale bar: 8 μm. (K) 4 wpf (8 mm standard length). Scale bar: 100 μm. (K′) Area outlined in K showing three-vessel pattern (main vein, artery and ancillary vein). Scale bar: 10 μm. (L) Schematic representation of artery-vein connections and marker gene expression in the caudal fin arteries and veins. |

ECs within the posterior circulatory loop of the fin vasculature become arterialized and activate cxcr4a and Notch signalling. (A) Still images at indicated time points of ECs sprouting from the PCV in Tg(fli1a:nEGFP)y7; Tg(-0.8flt1:RFP)hu5333 double-transgenic wild-type control animal, labelling EC nuclei (green) and arterial ECs (red). White arrowheads with numbers indicate individual ECs. Time-encoded migration tracks of marked ECs. t0=52 hpf. Schematic representation of sprout formation; white arrows indicate the direction of blood flow. Scale bar: 50 μm. (B) Still images at indicated time points of ECs sprouting from PCV in Tg(fli1a:nEGFP)y7; Tg(-0.8flt1:RFP)hu5333 double-transgenic cxcr4aum20 mutants. White arrowheads with numbers indicate individual ECs. Schematic representation of observed phenotype in cxcr4a mutants. Black arrowheads indicate clustering of arterial ECs at the tip of the sprout. Scale bar: 50 μm. (C) Maximum intensity projections of confocal z-stacks of Tg(fli1a:nEGFP)y7; Tg(-0.8flt1:RFP)hu5333; Tg(Tp1:Venus-Pest)s940 triple-transgenic fish labelling all EC nuclei (blue), arterial ECs (red) and cells with Notch pathway activation (green) in lateral views; anterior towards the left. White arrowheads indicate arterial ECs with activated Notch signalling. Boxed regions are enlarged. Scale bars: 20 μm (top row); 4 μm (middle and bottom rows). (D) Still images at indicated time points of ECs sprouting from PCV in Tg(fli1a:nEGFP)y7; Tg(cxcr4a:YFP)mu104; Tg(-0.8flt1:RFP)hu5333 triple-transgenic embryos labelling all EC nuclei (blue), arterial ECs (red) and cxcr4a-positive cells (green) in lateral views; anterior towards the left. White arrowheads indicate ECs that express cxcr4a and show onset of arterial specification. Boxed regions are enlarged. Scale bars: 20 μm (top row); 4 μm (middle and bottom rows). |

Formation of the posterior circulatory loop depends on VEGF signalling upstream of Notch signalling. (A,B) Maximum intensity projection of confocal z-stacks of Tg(fli1a:nEGFP)y7; Tg(-0.8flt1:RFP)hu5333. (A) Wild-type control. Scale bar: 10 μm. Schematic drawing indicates artery and vein. Yellow arrowheads indicate arterial ECs. (B) vegfaamu128 mutant. Schematic drawing indicates a tail blood vessel sprout lacking a discernible artery. Scale bar: 10 μm. Yellow arrowheads indicate arterial ECs. (C,D) Maximum intensity projections of confocal z-stacks of Tg(fli1a:nEGFP)y7; Tg (Tp1:H2B-mCherry)s939. (C) Wild-type control. (D) vegfaamu128 mutant. Scale bar: 10 μm. Yellow arrowheads indicate ECs with Notch pathway activation. (E,F) Maximum intensity projections of confocal z-stacks of TgBAC(cxcr4a:YFP)mu104; Tg(-0.8flt1:RFP)hu5333. (E) Wild-type control. (F) vegfaamu128 mutant. Scale bar: 10 μm. Yellow arrowheads indicate ECs expressing cxcr4a. (G) Quantification of ECs with Notch pathway activation in wild-type controls (n=10) and vegfaamu128 mutants (n=10). Unpaired t-test (****P≤0.0001). (H) Quantification of total and arterialized ECs in wild-type controls (n=11) and vegfaamu128 mutants (n=13). Unpaired t-test (****P≤0.0001). Data points indicate results from individual embryos. Data are mean±s.d. (I) Schematic representation of signalling pathways controlling vein-artery sprouting in the tail fin. |
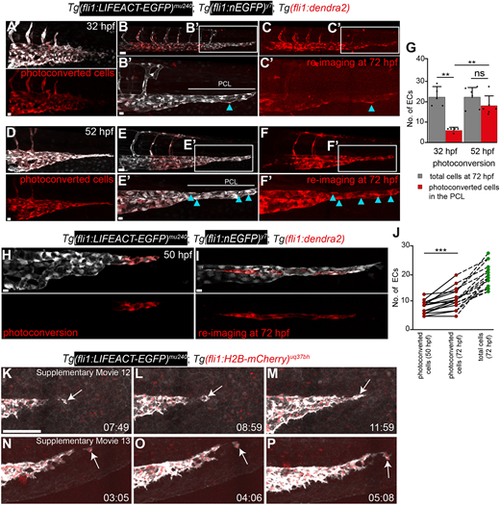
Newly differentiating angioblasts and EC proliferation contribute to the posterior circulatory loop. Maximum intensity projection of Tg(fli1:nEGFP)y7; Tg(fli1:LIFEACT-EGFP)mu240; Tg(fli1:dendra2) triple-transgenic embryos labelling ECs (white) and photoconverted ECs (red). (A) ECs photoconverted at 32 hpf. Scale bar: 10 μm. (B,C) Photoconverted ECs re-imaged at 72 hpf. Scale bar: 30 μm. (B′,C′) Few ECs contain photoconverted dendra2 (blue arrowheads). Scale bar: 10 μm. (D) ECs photoconverted at 52 hpf. Scale bar: 10 μm. (E,F) Photoconverted ECs re-imaged at 72 hpf. Scale bar: 20 μm. (E′,F′) Many ECs containing photoconverted dendra2 (blue arrowheads). Scale bar: 10 μm. (G) Quantification of ECs photoconverted at 32 and 52 hpf and their contribution to the posterior circulatory loop at 72 hpf. Paired t-test (**P=0.0013); ns, not significant. Data are mean±s.d. n=5 embryos (32 hpf), n=6 embryos (52 hpf). (H) Photoconversion of terminal cells in the sprouting PCV at 50 hpf. Scale bar: 10 μm. (I) Photoconverted embryos re-imaged at 72 hpf. Scale bar: 10 μm. (J) Quantification of photoconverted cells at 72 hpf. Paired t-test (***P=0.0002, n=15). (K-P) Still images at indicated time points from (K-M) Movie 12 and (N-P) Movie 13. Imaging is from 30 to 55 hpf. Scale bar: 40 μm. |

Proximal fin plexus and caudal fin arteries have distinct origins. Maximum intensity projections of confocal z-stacks of Tg(-0.8flt1:RFP)hu5333; Tg(flt4:citrine)hu7135 double-transgenic fish labelling all arterial ECs (black) and venous ECs (cyan) in lateral views; anterior towards the left. (A) Posterior circulatory loop (PCL) at 5 dpf. Scale bar: 10 μm. (A′) Proximal fin plexus. (A″) Distal fin vasculature. Scale bars: 4 μm. (B,C) Proximal fin plexus (red arrowhead); distal fin vasculature (blue arrowhead). Scale bar: 15 μm. (C′) Proximal fin plexus (red arrowheads) connection with the dorsal aorta (DA). Scale bar: 5 μm. (D-F) Formation of proximal fin plexus. Scale bars: 20 μm for D; 30 μm for E,F. (D′-F′) Formation of the proximal plexus from the DA. Scale bars: 7 μm for D′,F′; 5 μm for E′. |

Formation of the interlaced plexus at the fin base. (A-D″) Maximum intensity projections of confocal z-stacks of Tg(-0.8flt1:RFP)hu5333; Tg(flt4: citrine)hu7135 double-transgenic fish labelling all arterial ECs (black) and venous ECs (cyan). Scale bars: 30 μm for A; 50 μm for C; 100 μm for D. (A′,A″) Proximal fin plexus. Scale bar: 20 μm. (B,B′) Initial loops of the interlaced plexus at the fin base (pseudo-coloured in red in B′). Scale bar: 10 μm for B; 5 μm for B′. (C-D″) Interlaced plexus (pseudo-coloured in red). Blunt ends (C,C′, red arrowheads) and connections with bone enclosed arteries (D-D″, yellow arrowheads). Scale bar: 10 μm for C′; 20 μm for D′; 15 μm for D″. (E,E′) Maximum intensity projections of confocal z-stacks of Tg(fli1:LIFEACT-EGFP)mu240; Tg(-0.8flt1:RFP)hu5333 double-transgenic fish labelling all arterial ECs (red/cyan) and all ECs (white/black). Scale bars: 20 μm for E; 7 μm for E′. (F) Comparison of the diameters of bone-enclosed artery (BEA) and interlaced plexus (IP). Paired t-test (****P≤0.0001; n=17 segments from three individual fish for diameter measurements of the IP and BEA; data points indicate individual segments; data are mean±s.d.). (G) Flt1 fluorescence intensity measurements. Paired t-test (****P≤0.0001; n=30 cells for IP; n=32, data points indicate intensity values of individual cells; data are mean±s.d.). (H) Maximum intensity projections of confocal z-stacks of Tg(-0.8flt1:RFP)hu5333; TgBAC(pdgfrb:gal4ff;UAS:GFP)ncv24tg, nkuasgfp1a double-transgenic fish labelling all arterial ECs (red/cyan) and mural cells (white/black) in lateral views; anterior towards the left. (H′) Mural cells on the IP and BEA (red arrowheads). Scale bars: 10 μm for H; 5 μm for H′. (I) Maximum intensity projections of confocal z-stacks of Tg(Fli1:EGFP)y1; TgBAC(acta2:mcherry)ca8Tg labelling all ECs (white) and smooth muscle cells (red). (I) Proximal area. Scale bar: 50 μm. (I′) Distal area. Scale bar: 10 μm. (J-J″) Maximum intensity projections of confocal z-stacks of Tg(-0.8flt1:RFP)hu5333; qdot705 injections labelling arterial ECs (white) and blood vessel lumina (magenta). Yellow arrowheads indicate red blood cells. Scale bar: 20 μm for J; 7 μm for J′ and J″. |

The fin vascular network expands through vein-derived sprouting of new veins and arteries. (A) Maximum intensity projections of confocal z-stacks of Tg(-0.8flt1:RFP)hu5333; Tg(flt4: citrine)hu7135 double-transgenic fish at 3 wpf (6 mm standard length) labelling arterial ECs (red) and venous ECs (white) in lateral views; anterior towards the left. Scale bar: 20 μm. (B) Dorsal lobe. (B′) Mid lobe. (B″) Ventral lobe. Scale bar: 30 μm. (C) Growth of ancillary vein. Scale bar: 30 μm. (D,E) Formation of artery-vein connections. Activation of arterial marker in single venous ECs (white arrows). Scale bar: 10 μm. (F) Distal end of caudal fin blood vessels. ECs transitioning from venous (blue arrowheads) to arterial (red arrowheads). Scale bar: 10 μm. (G) Schematic representation of ancillary vein sprouting and artery-vein connections. (H) Schematic representation of caudal fin vasculature at 3 wpf (6 mm standard length). |

Inter-ray connections are formed by lateral sprouting and intussusceptive angiogenesis. (A) Maximum intensity projections of confocal z-stacks of Tg(-0.8flt1:RFP)hu5333; Tg(flt4: citrine)hu7135 double-transgenic fish labelling all arterial ECs (red) and venous ECs (white). Caudal fin of 1.5-month-old fish. Scale bar: 300 μm. (B) Distal end of caudal fin vasculature. Scale bar: 20 μm. (C) Blue arrowheads indicate venous ECs; red arrowheads indicate arterialized ECs. Scale bar: 5 μm. (C′) 3D reconstruction of boxed region in C shows pillars in veins (red dashed lines). (D) Connection between bone-enclosed artery and peripheral arterial cells (red arrowheads). Scale bar: 10 μm. Intussusceptive angiogenesis and looping occurred in 22 out of 25 fin rays (n=4 animals). (E) Lateral connections. Scale bar: 20 μm. (E′,E″) Sprouts originating from veins. Venous ECs occupy the leading edge (blue arrowheads); arterial cells trail behind (red arrowheads). Scale bars: 4 μm for E′; 5 μm for E″. (F,F′) Inter-ray connection between artery (red arrowheads) and vein (blue arrowheads). Scale bar: 20 μm for F; 5 μm for F′. (G) Stages in the formation of inter-ray connections. |

Schematic representation of caudal fin vascular development. (A) Initiation of caudal fin development through vein-artery sprouting, indicated throughout the figure by red-blue arrows. (B) The posterior circulatory loop consists of PCLa connected to DA, and PCLv connected to PCV. (C) Ventral sprouting from PCLv. (D) Ventral sprouting from the DA/PCV junction through plexus sprouting (yellow arrow). (E) At 2 wpf (5.2 mm standard length), the PFP expands to form the dPFP and vPFP (yellow arrows), and the CFP expands into a growing fin through vein-artery sprouting (red-blue arrows). (F) At 3 wpf (6 mm standard length), the CFP remodels into a two-vessel pattern consisting of a BEA and a main vein, and the IP forms (yellow arrow). (G) Ancillary vein sprouting (blue arrows) establishes a three-vessel pattern, vein-artery sprouting continues distally (red-blue arrows) and the IP expands (yellow arrow). (H) Intussusceptive angiogenesis generates new arterial side branches (black arrows). (I) Inter-ray connections are formed (black arrow). Abbreviations: BEA, bone-enclosed artery; CFP, caudal fin plexus; DA, dorsal aorta; IP, interlaced plexus; IRC, inter ray connection; PCLa, posterior circulatory loop artery; PCLv, posterior circulatory loop vein; PCV, posterior cardinal vein; PFP, proximal fin plexus; dPFP, dorsal proximal fin plexus; vPFP, ventral proximal fin plexus. |