
- Title
-
Transcriptomes of Zebrafish in Early Stages of Multiple Viral Invasions Reveal the Role of Sterols in Innate Immune Switch-On
- Authors
- Ouyang, G., Yuan, L., Xia, X.Q., Zhang, W., Shi, M.
- Source
- Full text @ Int. J. Mol. Sci.
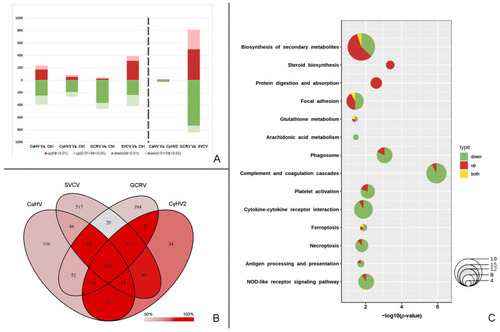
Summary diagrams of DEGs and PBGs. (A) Stacked bars of DEGs. (B) The Venn diagram of DEGs in the infections by four viruses. The depth of red is in accord with the proportion of PBGs. (C) Bubble pie chart of enriched pathways based on PBGs. Red indicates upregulated PBGs, green indicates downregulated PBGs, and yellow indicates genes with multiple copies, some of which are upregulated and the others downregulated. |

Diagrams of enriched pathways based on DEGs and PBGs in infections by four viruses, respectively. Heat map: The p-values of the enriched pathway based on the DEGs and PBGs per virus. Bar plot: The number of PBGs and non-PBGs per virus in each enriched pathway. |

The network of enriched pathways and heat maps of DEGs. The order of four viruses in all the heat maps is CaHV, CyHV2, GCRV, and SVCV. |

Summary of DEG analysis by dimensions. (A) Expression levels of two DEGs between DNA virus and RNA virus. (B) Percentage stacked bar chart of the enriched pathways based on DEGs between infections by two RNA viruses. Red block: metabolic-related pathways. Yellow block: nerve signal transmission pathways. Green block: signal transduction pathways. Blue block: immune-related pathways. (C) DEGs and enriched GO terms between the infections by two DNA viruses. (C1) The heat map of the log2 (fold change) of 43 DEGs with nr alignments. (C2) Grid graph to show DEGs corresponding to the four groups of enriched GO terms. (C3) The first 15 enriched GO terms of biological process (BP) with the lowest p-value. The x-axis is for the function categories of the GO terms. The y-axis coordinate was the four groups of GO terms. |

The curation of WGCNA analysis. (A) The scatter boxplot of gene counts for 39 classes. (B) The KEGG enrichment of the 6 outlier classes. The y-axis shows the top 5 enriched pathways of each class and the bubbles show the enrichment of the 6 classes on these selected pathways. (C) Upper triangle shows the correlation coefficients between IRF3/IRF7 and PRRs. The naming rule for the y-axis is GeneID_class NO. Symbol, and the tag of the x-axis is simplified to symbol. Lower triangle shows the correlation coefficients between IRF3/IRF7 and the genes in the top 5 enriched pathways of class 3. |

The RT-qPCR validation of DEGs of sterol biosynthesis. |