
- Title
-
From Multi-Allele Fish to Non-Standard Environments, How ZFIN Assigns Phenotypes, Human Disease Models, and Gene Expression Annotations to Genes
- Authors
- Bradford, Y.M., Van Slyke, C.E., Howe, D.G., Fashena, D., Frazer, K., Martin, R., Paddock, H., Pich, C., Ramachandran, S., Ruzicka, L., Singer, A., Taylor, R., Tseng, W.C., Westerfield, M.
- Source
- Full text @ Genetics

Gene page gene expression. Gene expression displayed on the gene page is limited to gene expression results in wild-type backgrounds. The Wild-Type Expression Summary displays a graphical ribbon that denotes the anatomical systems and stages that have gene expression annotations. The table lists the anatomical terms, stages, and citations. |
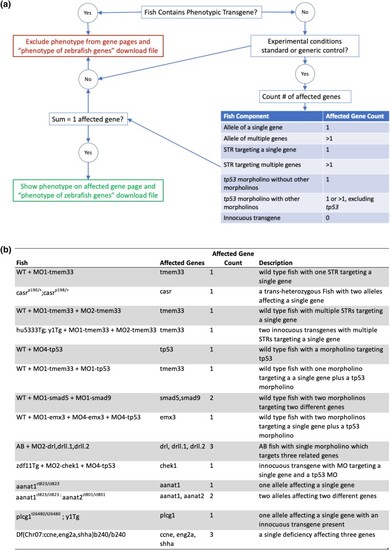
Logic for determining Fish affected gene count. a) A logic flow diagram describing the algorithm used to determine number of affected genes in a Fish and whether phenotype data can be shown on a gene page. b) A table of examples of Fish that result in variable numbers of affected genes. |
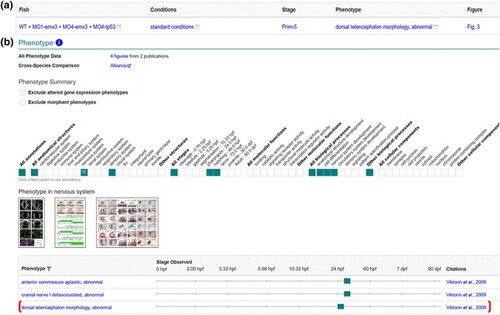
Display of MO-tp53 Fish data on gene page. a) Phenotype data for Fish WT + MO1-emx3 + MO4-emx3 + MO4-tp53 in standard conditions as reported in Viktorin et al. (2009). b) The phenotype summary section on the emx3 gene page has a ribbon that denotes systems, stages, biological processes, and cellular components that have annotations, with individual annotations displayed in the table. Thumbnail images are displayed when available. Phenotype corresponding to Fish in A is denoted by bracket. |

STR page. Expression display is limited to Fish with a wild-type background under standard or control conditions. Phenotype display is divided into two sections, the first labeled “Phenotype resulting from MO1-vcana” contains phenotype only in wild-type or innocuous transgenic fish with standard conditions. Phenotype in more complex fish or under nonstandard conditions as well as the phenotype from the previous section is displayed in the section labeled “Phenotype of all Fish created by or utilizing MO1-vcana.” |
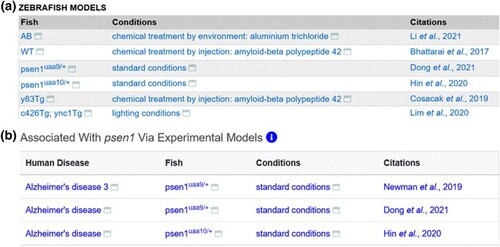
Display of disease model data. a) Zebrafish Models table from the Alzheimer's disease term page displaying all Fish and experimental conditions that are annotated as disease models. b) Human disease model table from the psen1 gene page, showing the diseases associated with psen1 via experimental models that have a single affected gene Fish in standard conditions. |