- Title
-
In silico studies, X-ray diffraction analysis and biological investigation of fluorinated pyrrolylated-chalcones in zebrafish epilepsy models
- Authors
- Mohd Fahmi, M.S.A., Swain, P., Ramli, A.H., Wan Ibrahim, W.N., Saleh Hodin, N.A., Abu Bakar, N., Tan, Y.S., Mohd Faudzi, S.M., Kim, C.H.
- Source
- Full text @ Heliyon
|
Structure of (a) 2- and (b) 3-fluoropyrrolylated chalcones [11]. |
|
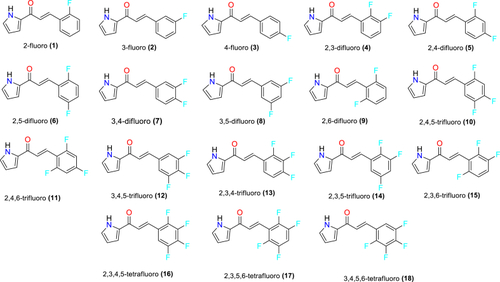
Structures of the fluorine-containing pyrrolylated chalcones (1–18). |
|
The validation of co-crystallized and re-docked BEN500. |
|
2D diagram of the binding interactions of compound 8 with the active site residues of the GABAA receptor (Green: Hydrogen bonding, Cyan: Halogen (F), pink: π-π stacked, purple: π-σ) |
|
Molecular structure of compound 8 showing the atom-labelling schemes and displacement ellipsoids at the 70% probability level. |
|
Toxicity profiles of zebrafish embryos at 24 to 72 hpf based on (A) mortality rate, (B) LC50, (C) spontaneous tail coiling (STC), and (D) hatching rate. Results are expressed as mean ± standard error of the mean (SEM) (n = 30). Statistical analysis was performed using the one-way analysis of variance (ANOVA) test and a Tukey post-test. (*p < 0.05, **p < 0.01, ***p < 0.001; the p-value is the marginal significance level within a statistical hypothesis test that indicates the probability of a particular event occurring.). |
|
Locomotor activity in PTZ-induced larvae of zebrafish exposed to the tested compounds at 5 dpf (days post-fertilization). (A) Total distance travelled, (B) average distance travelled, (C) total speed travelled, (D) average speed travelled, and (E) distance spent in the inner area. Results are presented as mean ± SEM (n = 30). Statistical analysis was performed using one-way ANOVA test followed by Tukey post-test; compared to control (*p < 0.05, **p < 0.01, ***p < 0.001) and compared to PTZ (#p < 0.05, ##p < 0.01, ###p < 0.001). |
|
Quantification of freezing behaviour in PTZ-induced larvae of zebrafish exposed to the tested compounds at 5 dpf. (A) Total freezing count, (B) average freezing count, (C) total freezing duration, (D) average freezing duration, and (E) correlation of total freezing count and total speed measured for the PTZ+8 group. Results are expressed as mean ± SEM (n = 30). Statistical analysis was performed using a one-way ANOVA test followed by Tukey post-test; compared to control (*p < 0.05, **p < 0.01, ***p < 0.001) and compared to PTZ (#p < 0.05, ##p < 0.01, ###p < 0.001). |
|
ZEBRA device for phenotypic study of compound 8 using the zc4h2 zebrafish KO epilepsy in vivo model. |
|
(A) Jaw movements and (B) heartbeat of 5 dpf larvae of zebrafish zc4h2 KO epilepsy after exposure to compound 8. |


