
- Title
-
Converging Role for REEP1/SPG31 in Oxidative Stress
- Authors
- Naef, V., Meschini, M.C., Tessa, A., Morani, F., Corsinovi, D., Ogi, A., Marchese, M., Ori, M., Santorelli, F.M., Doccini, S.
- Source
- Full text @ Int. J. Mol. Sci.
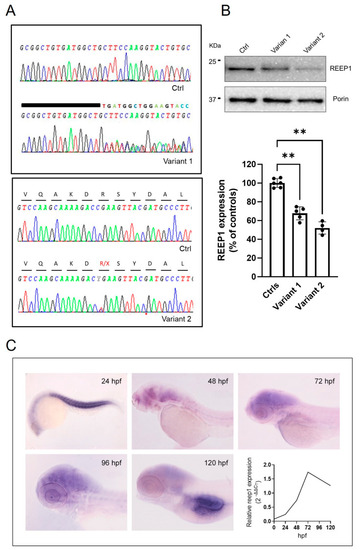
Molecular studies in the analyzed disease models. (A) Genetic studies of DNA from mutated fibroblasts show the electropherogram of exon 5 flanking the c.401_409dup9del19 and c.337C > T mutations. A wild-type REEP1 sequence is also reported as a reference. (B) Representative WB and quantification of REEP1 protein expression levels related to both mutant cell lines and control. Porin expression was used as a loading control. A significant reduction in REEP1 protein expression was observed with residual levels between 50 and 70% compared to controls. Three different control fibroblasts (in technical duplicate) and two subjects for each mutation (in technical triplicate) were analyzed and plotted both as individual values and histograms with mean and SD. ANOVA test (one-way ANOVA) was used to compare the mean levels of each mutated line with the control mean. ** p < 0.01. (C) Spatial-temporal expression of reep1 mRNA during zebrafish embryogenesis. WISH of zebrafish reep1 was performed at different developmental stages (from 24 to 120 hpf), and qRT−PCR analysis showed reep1 developmental relative expression from 0 hpf to 120 hpf in WT zebrafish. |
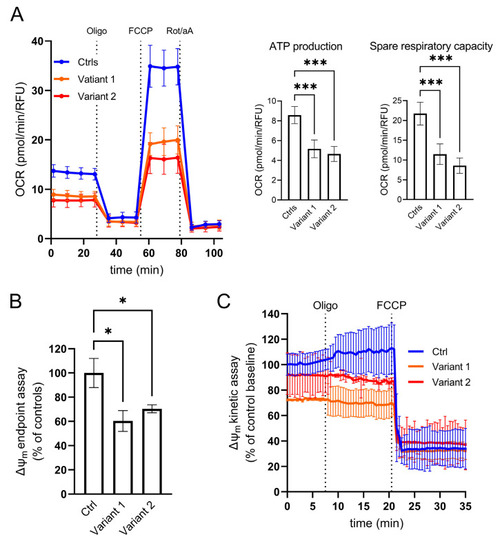
Cellular analysis of mitochondrial function. (A) Micro-oxygraphy track showing a reduced OCR in mutated cell lines, which is clearly evident after FCCP injection, reflecting a deficient spare respiratory capacity. Data represent mean ± SEM of controls (n = 3) and patients (n = 2 for each mutation). Two independent experiments were run with four technical replicates for each cell line. (B–C) Mitochondrial membrane potential profiles evaluated both in terms of TMRM probe accumulation and membrane potential maintenance. (B) End-point assay indicating a mitochondrial membrane depolarization in mutated fibroblasts reported as percentage of controls. Data were normalized by DAPI staining as a function of cell number. (C) Kinetic track demonstrates the ability of REEP1 cultured skin fibroblasts to maintain polarized mitochondrial membrane after oligomycin blocking proton transit through Complex V, highlighting any leakage of the inner mitochondrial membrane. FCCP was added at the end of the experiments to fully depolarized mitochondrial to demonstrate the specificity of measurements. Data represent mean ± SEM of controls (n = 3) and patients (n = 2 for each mutation). A technical triplicate was assessed for endpoint assay, whereas for kinetic analyses, cell lines were acquired in an independent experiment recording 10 different ROIs/field over time. For all the reported experiments, statistics were assessed by ordinary ANOVA test (one-way ANOVA). * p < 0.05; *** p < 0.001. |
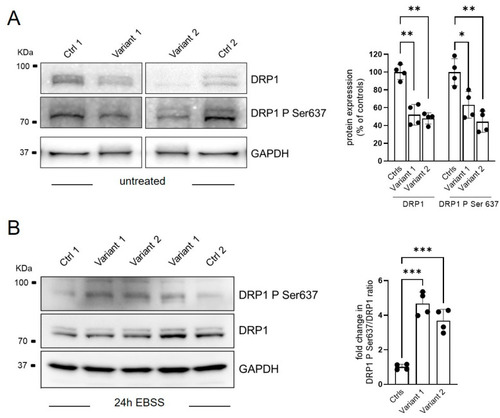
Regulation of mitochondrial dynamics via DRP1-Ser637 phosphorylation status. Representative WB analysis of DRP1 phosphorylation process in basal condition (A) and after 24 of starvation (EBSS treatment) (B). Two different control fibroblasts and two subjects for each mutation in technical duplicate were analyzed and plotted as histograms with both mean ± SD and individual values of replicates. Ordinary ANOVA test (one-way ANOVA) was used to compare the mean levels of each mutated line with the control mean. * p < 0.05; ** p < 0.01; *** p < 0.001. |
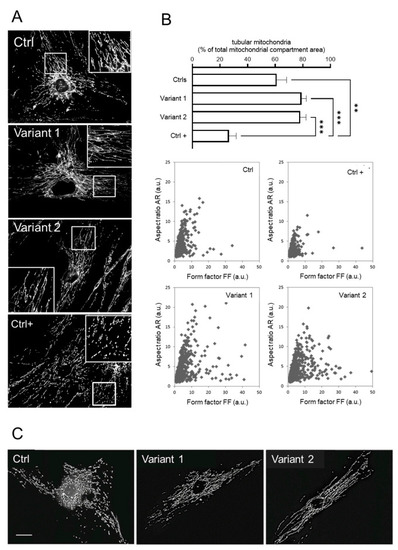
Mitochondrial morphology investigations in skin fibroblasts. (A) The mitochondrial network analysis by fluorescence microscopy showed hyperfused tubules in REEP1 mutated fibroblasts as compared with control. A control line under the effect of FCCP was used as positive control of the fragmented network (Ctrl +). (B) Morphometric analysis showing a significant increase in tubular mitochondria in patients. Statistics was assessed by ordinary ANOVA test (one-way ANOVA). ** p < 0.01; *** p < 0.001. Computer-assisted morphological analyses of mitochondrial AR plotted as function of FF showed in SPG31 patients’ cells higher values for both FF and AR (tubular and hyperfused mitochondria). Ctrl + indicates a positive control with very low levels of fragmented mitochondria. (C) Representative fluorescence microscopy images of MitoTracker Red in fibroblasts 30 min after treatment with 2 µM FCCP. Unlike the control line, no fragmented mitochondria were observed in both mutated fibroblasts. Scale bar: 20 µm. |
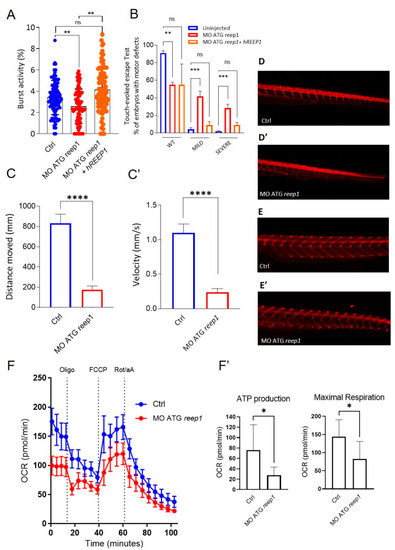
Phenotype characterization of the reep1 zebrafish model. (A) Coiling frequency in zebrafish embryos at 30 hpf is decreased in reep1 morphant compared with WT (MO ATG reep1 n = 90; controls n = 90; MO ATG reep1 + hREEP1 n = 90, in 3 independent experiments). The co-injection of embryos at one-cell stage with human mRNA/REEP1 and reep1 MO ATG was able to rescue the locomotor impairment. (B) Touched evoked response analysis, showing decreased movement in response to touch stimulus of morphants at 48 hpf compared to uninjected controls. The co-injection of embryos at 48 hpf with human mRNA/REEP1 and reep1 MO ATG was able to rescue the touched evoked phenotype. Statistics were calculated by a two-tailed unpaired t-test. (C,C’). Automated analysis of spontaneous motor activity revealed a reduction in swim distance and velocity in reep1 morphant larvae at 120 hpf compared to control siblings (MO ATG reep1 n = 120; controls n = 120, in 3 independent experiments). (D,D’). Lateral tail views at 48 hpf of whole-mount larvae labeled with anti-acetylated alfa-tubulin (MO ATG reep1 n = 40; controls n = 40). (E,E’) Lateral tail views at 120 hpf of whole-mount larvae labeled with anti-znp1 (MO ATG reep1 n = 40; controls n = 40). (F,F’) Mitochondrial respiratory analysis of controls (n = 20) and reep1 morphant larvae (n = 20) at 120 hpf. Statistics were calculated by Mann–Whitney test in panels (A,C,F), whereas in panel (B) by two-tailed unpaired t-test. * p < 0.05, ** p < 0.01, ***p < 0.001; **** p < 0.0001, ns, not significant. |

Evaluation of the susceptibility to oxidative stress in REEP1/SPG31 disease models and resveratrol modulatory effect on ROS overproduction. (A) Under both regular medium (RM) and stress conditions, patients produced a significantly greater amount of ROS compared with controls, indicating an increased susceptibility to oxidative stress. Resveratrol treatment reduces the ROS levels restoring the control values. Data represent mean ± SEM of controls (n = 3) and patients (n = 2 for each mutation) analyzed in technical duplicate (controls) or triplicate (patients). Statistical analysis was performed by ordinary ANOVA test (one-way ANOVA). * p < 0.05; ** p < 0.01; *** p < 0.001. (B) Representative fluorescence images of ROS generation in zebrafish larvae at 24 hpf (MO ATG reep1 n = 30; controls n = 30; MO ATG reep1+ Res 5µM n = 30, in 3 independent experiments. Graphs show the quantitative analysis of fluorescent signals. *** p < 0.01 was calculated by Dunnett’s multiple comparisons test. Abbreviations: n, number of evaluated embryos in total; ns, not significant. The values are expressed as mean ± standard deviation (SD). PHENOTYPE:
|