FIGURE SUMMARY
Title

Identification of Novel Coloboma Candidate Genes through Conserved Gene Expression Analyses across Four Vertebrate Species

Authors
Trejo-Reveles, V., Owen, N., Ching Chan, B.H., Toms, M., Schoenebeck, J.J., Moosajee, M., Rainger, J., Genomics England Research Consortium
Source
Full text @ Biomolecules

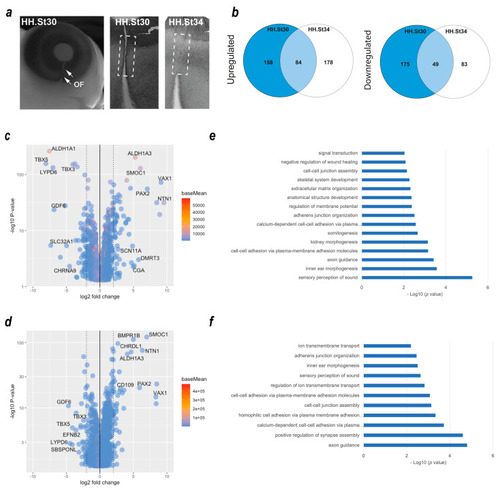
Transcriptome profiling of chicken optic fissure closure. (a) Schema for segmental dissection of chick OFM tissue at the fusing (HH.St30) and fused (HH.St34) OFC stages, with arrows indicating the limits of the optic fissure margin. (b) Venn diagrams representing the number of DEGs that were (left) significantly upregulated: Fissure expression > Dorsal, or (right) downregulated: Dorsal expression > fissure) between the fusing HH.st30 fissure (blue circle) and fused HH.st34 fissure tissue (clear circle). The number of DEGs that are commonly upregulated/downregulated between the two stages is indicated in the overlapping region. (c) Volcano plot showing differentially expressed genes in the fusing stage HH.st30 OFC transcriptomes. (d) Volcano plot showing differentially expressed genes in the fused stage HH.st34 transcriptomes. Genes with the greatest differential changes are labelled for each graph. (e,f) Plots showing DAVID enrichment analysis outputs for fissure-specific DEGs at the two developmental stages ((e), HH.St30; (f), HH.St34). Values shown are −Log10 (p value). All accompanying enrichment and gene expression analysis data are in Supplemental Table S1.

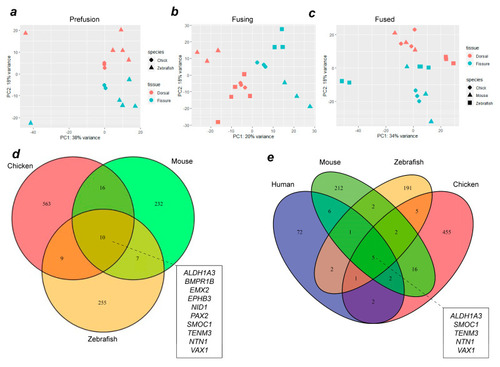
Combined transcriptome analysis across vertebrate species reveals common gene expression signatures during OFC. PCA analyses for aligned transcriptomes for chicks and zebrafish (a), or for chicks, zebrafish, and mice (b,c) at OFC stages prior to fusion (a), active fusion (b), or fused fissure stages (c). (d) Venn diagram showing intersection analysis for fissure-enriched DEGs for all stages of OFC between mice, chicks, and zebrafish. There were 10 fissure-specific DEGs shared among all three species: EPHB3, ALDH1A3, BMPR1B, EMX2, NTN1, PAX2, SMOC1, VAX1, TENM3, and NID1. (e) Analysis of shared DEGs among all four species identified five genes with fissure-enriched expression throughout OFC in humans, mice, chickens, and zebrafish: SMOC1, NTN1, ALDH1A3, VAX1, and TENM3. Additional genes whose expression is conserved to humans from each single species are listed in Supplemental Table S1.

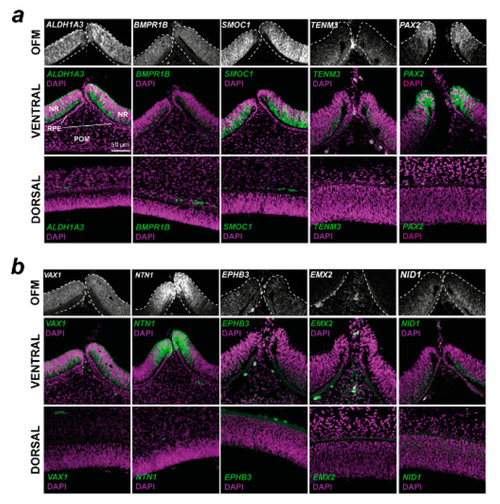
Spatial gene expression analysis for 10 conserved fissure-enriched genes in the developing chick eye. Fluorescent in situ hybridisation for (a) known coloboma gene targets and (b) OFC candidate genes identified in this study was counterstained with DAPI nuclear stain on chick eyes at HH28, immediately prior to fusion. Note that for EMX2, the OFM region highlights the POM region; expression was not observed in the NR or RPE. In both (a,b), Top: grayscale RNAscope probe signal without DAPI highlighting the mRNA signal in the immediate optic fissure margin region. Middle: mRNA probe and DAPI merged images of the broad ventral eye region. Bottom: Dorsal eye region with probe and DAPI merged. OFM, optic fissure margin; NR, neural retina; POM, periocular mesenchyme; RPE, retinal pigmented epithelium. Scale = 50 µm.

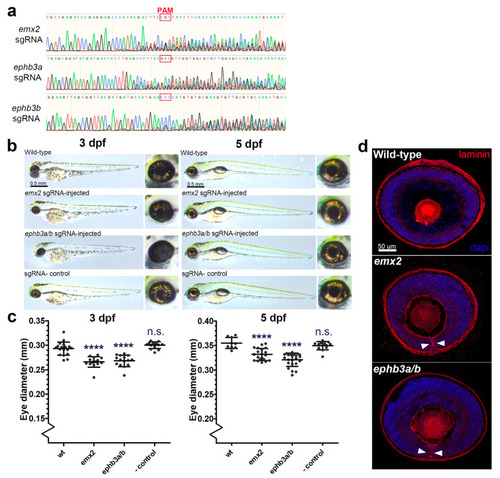
Targeted gene disruption of OFC novel candidates using CRISPR/Cas9 gene targeting in zebrafish embryos. (a) Sanger sequence traces for genomic DNA PCR analysis of CRISPR/Cas9 targeted embryos show successful genetic disruption at the sgRNA site loci for eph3ba, eph3bb, and emx2. PAM sites are indicated. (b) Brightfield microscopy analysis of targeted fish at 3 dpf and 5 dpf compared to uninjected controls and Cas9-only controls. (c) Eye diameter metrics for fish injected with CRISPR/Cas9 at 3 dpf and 5 dpf (**** = p < 0.0001). (d) Confocal analysis of laminin-stained cryosections from gene-edited and control eyes showing persistence of the basement membrane in the optic fissure margin (arrowheads). Colobomas were observed in 27% and 47% of gene-edited embryos analysed for emx2 and ephb3a/b, respectively (n = 15 per target gene).

Acknowledgments
This image is the copyrighted work of the attributed author or publisher, and ZFIN has permission only to display this image to its users. Additional permissions should be obtained from the applicable author or publisher of the image. Full text @ Biomolecules