
- Title
-
A CRISPR-Cas9-mediated F0 screen to identify pro-regenerative genes in the zebrafish retinal pigment epithelium
- Authors
- Lu, F., Leach, L.L., Gross, J.M.
- Source
- Full text @ Sci. Rep.
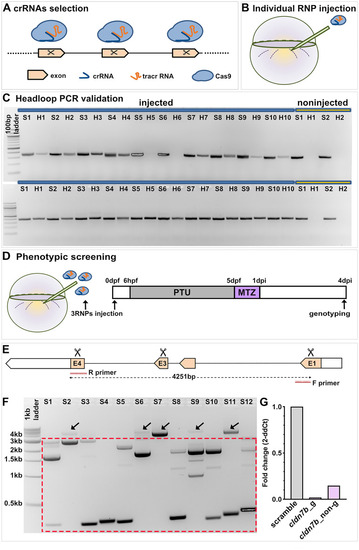
F0 screening pipeline to identify genes regulating RPE regeneration. (A) Design and selection of crRNAs. (B) Injection of individual RNP complexes (gRNAs (crRNA:tracrRNA) with Cas9 protein) into rpe65a:nfsB-eGFP embryos. (C) Example electrophoresis results of headloop PCR (H) targeting zgc:153911 (top gel) and nrg1 (bottom gel) in parallel with standard PCR (S) from ten RNP-injected embryos and two uninjected controls. Mutagenic rate = H+/S+ number of embryos. Mutagenic rate for zgc:153911: 80%; for nrg1: 100%. (D) Schematic of the injection/ablation and screening paradigm. (E) Schematic of cldn7b showing exon 1 (E1), 3 (E3), and 4 (E4) target loci (scissors) and PCR strategy to confirm intragenic deletions. (F) Example cldn7b data from individual RNP-injected larvae confirming intragenic deletions generated by simultaneously targeting three genomic sites. Gel bands within the dashed box indicate intragenic deletions. ~ 4 kb bands (arrows) represent either wild-type or mutated alleles with small indels. (G) Bar graph showing relative expression fold change of cldn7b from genotyped (cldn7b_g) and non-genotyped (cldn7b_non-g) F0 knockout larvae and scrambled controls. Each bar represents biological variation from n = 50 pooled larvae and technical variation from three replicates. Example gels shown in (C) and (F) have been color inverted and cropped for clarity and data presentation purposes. Original gel images are shown in Fig. S9. Abbreviations as follows: RNP, ribonucleoprotein; PTU, n-phenylthiourea; MTZ, metronidazole; hpf/dpf, hour/day (s) post-fertilization; dpi, day (s) post-injury. |
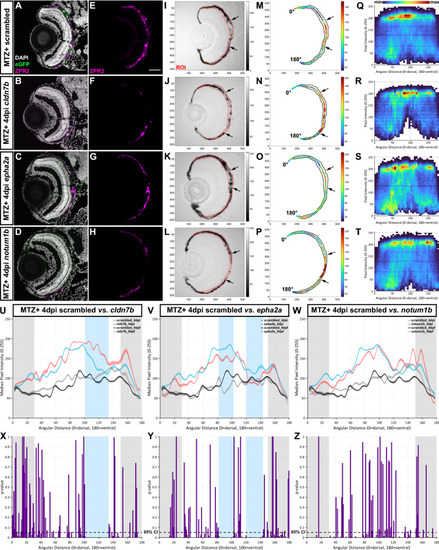
Representative screening results. (A–L) Representative immunofluorescence images of transverse cryosections from ablated (MTZ+) scrambled, cldn7b, epha2a, and notum1b RNP-injected F0 larvae at 4dpi. Single-channel ZPR2 (E–H) and brightfield (I–L) images. Grayscale bars indicate an 8-bit scale (0 = black, 255 = white). Black arrows delineate edges of pigment recovery. Regions of interest (ROIs) are outlined in red. Nuclei (white), eGFP (green), ZPR2 (magenta). (M–P) Median pixel intensity distributions in the ROI. Color bars indicate an 8-bit scale (0 = dark blue, 255 = dark red). (Q–T) Heatmaps showing dorsal-to-ventral (angular distance from 0 to 180°) distribution of raw pixel intensity values within each ROI from ablated scrambled, cldn7b, epha2a, and notum1b RNP-injected F0 larvae at 4dpi. Color bar above (Q) indicates bin counts. (U–W) Plots showing median ROI pixel intensity values from 4dpi ablated (blue and red lines) and 9dpf unablated (black and gray lines) scrambled, cldn7b, epha2a, and notum1b RNP-injected F0 larvae. (Q–W) Bin size = 5 angular degrees. (X–Z) Statistical comparisons of dorsal-to-ventral median pixel intensity between: (X) scrambled and cldn7b, (Y) scrambled and epha2a, and (Z) scrambled and notum1b. Blue shading indicates regions with significant differences spanning > 20 angular degrees. Gray shading indicates the dorsal (0 to 30 angular degrees) and ventral (150 to 180 angular degrees) peripheral RPE areas omitted from analyses. Dashed black lines indicate a 95% confidence interval (CI), Bin size = 1 angular degree. Scale bars = 50 μm. Exact regions with significant differences compared to scrambled controls can be found in Table S2 Abbreviations as follows: MTZ Metronidazole; dpi Days post-injury; min Minimum; max Maximum. |
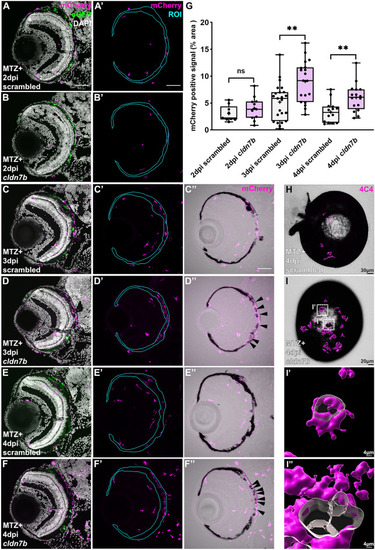
cldn7b F0 larvae show retention of macrophages/microglia and impaired clearance of pigment debris during RPE regeneration. (A–F) Representative immunofluorescence images of mCherry signal in ablated (MTZ +) scrambled and |