
- Title
-
A single-cell resolution gene expression atlas of the larval zebrafish brain
- Authors
- Shainer, I., Kuehn, E., Laurell, E., Al Kassar, M., Mokayes, N., Sherman, S., Larsch, J., Kunst, M., Baier, H.
- Source
- Full text @ Sci Adv
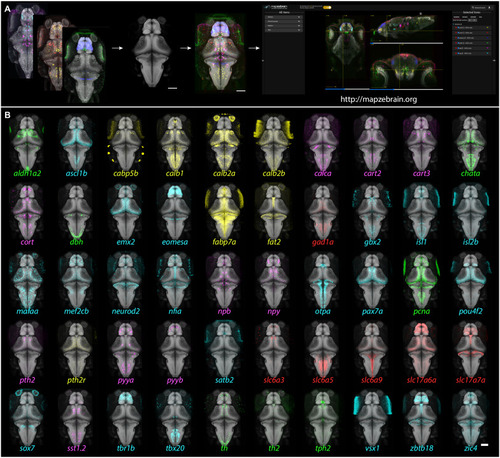
Gene expression atlas of the larval zebrafish brain: Pipeline and example patterns.
(A) Multiplexed FISH was performed on 6-dpf Tg(elavl3:H2b-GCaMP6s) fish. The GCaMP6s signal was used to align the images to the reference brain, and the aligned images were then uploaded to the mapzebrain atlas. Scale bar, 100 μm. (B) 3D projections of 50 selected FISH images, registered into the standard brain. Color coding: green, enzymes; cyan, transcription factors; red, neurotransmitter synthesizing enzyme (GABAergic) and transmitter transporters (glutamatergic); magenta, neuropeptides; yellow, miscellaneous other. Scale bar, 100 μm. |
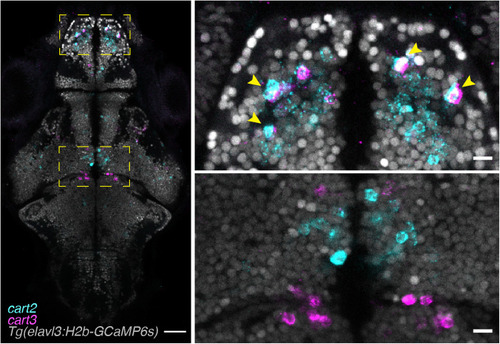
Multiplexed HCR in situ labeling of single cells.
Example of a single focal plane of a multiplexed HCR labeled fish. The endogenous expression of Tg(elavl3:H2b-GCaMP6s) labels neuronal nuclei and can be used to segment single neurons and to identify whether genes (here cart2 and cart3) are coexpressed (top right panel, arrowheads) or not (bottom right panel). Scale bars, 100 μm (left) and 10 μm (right). |
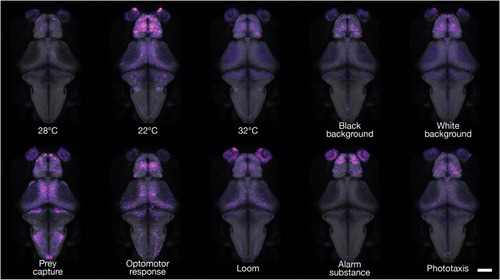
cfos brain activity maps of freely swimming fish.
3D projections of cfos FISH-labeled areas of neuronal activity during behavior. Dorsal views are shown for each experimental condition. For interactive viewing, spanning the full depth of the brain, see mapzebrain atlas at https://mapzebrain.org/. Scale bar, 100 μm. |
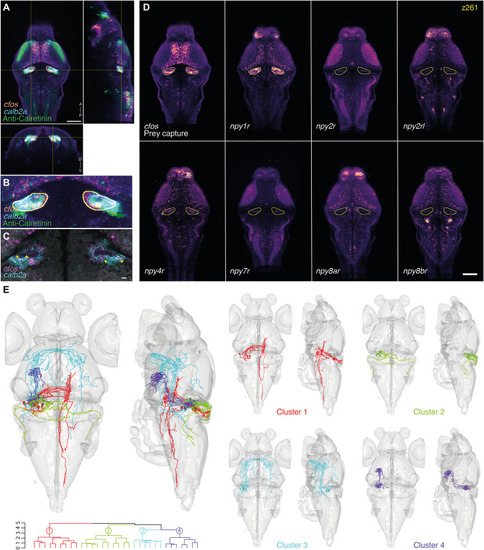
Marker gene expression and hypothetical connectivity of SGN neurons involved in prey capture.
(A) Orthogonal views of the cfos prey capture brain activity map with the registered calb2a FISH and anti-Calretinin immunostaining. An ROI is drawn around the cfos-positive SGN area (yellow). Scale bar, 100 μm. A, anterior; D, dorsal; P, posterior; V, ventral. (B) Enlargement of the cfos-positive SGN area. Possible colabeling was identified between the registered cfos and calb2a data. (C) Multiplexed FISH of calb2a and cfos verified the suggested colabeling (arrowheads). A single focal plane of an individual larva is shown. Scale bar, 10 μm. (D) Expression patterns of several NPY receptors in the same single z plane (z261). The yellow line labels the cfos + SGN area. npy1r shows strong expression within the SGN, which is not seen for the other tested NPY receptors. Scale bar, 100 μm. (E) The ROI drawn in (A) was used to search for single neurons whose somas are within the ROI. Thirty-two neurons were identified, mirrored onto the left hemisphere [see (20)] and hierarchically clustered according to their morphology. One cluster of Purkinje cells (cluster 2) projecting to the octavolateralis nucleus was identified, as well as three clusters of SGN neurons, with projections to the contralateral hindbrain (cluster 1), to the contralateral retinal AF7 and tectum through the postoptic commissure (cluster 3), and to the hypothalamus (cluster 4). |