
- Title
-
Acrolein-inducing ferroptosis contributes to impaired peripheral neurogenesis in zebrafish
- Authors
- Qi, H., Kan, K., Sticht, C., Bennewitz, K., Li, S., Qian, X., Poschet, G., Kroll, J.
- Source
- Full text @ Front. Neurosci.
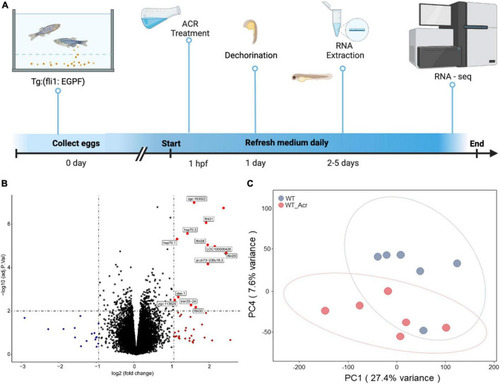
RNA-Seq analysis of wildtype zebrafish with or without acrolein (ACR) treatment at larval stage. (A) Scheme of experimental design for larval RNA-Seq. 30 larvae per clutch, 6 clutches of WT and WT & ACR zebrafish larvae at 5 dpf were applied for RNA-Seq analysis. (B) Volcano plot showed significantly up-regulated (red dots) genes (logFC > 1, adj.P.val < 0.01) in WT & ACR zebrafish larvae. (C) Gene expression patterns between WT and WT & ACR zebrafish larvae at 5 dpf were analyzed using PCA. The PC1 and PC4 are represented on the X-axis and Y-axis, respectively. PCA, principal component analysis; PC1, principal component 1; PC4, principal component 4; dpf, day post fertilization. |
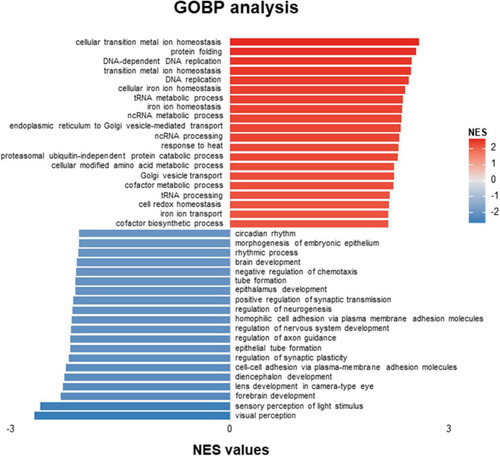
GOBP-analysis of RNA-Seq data showed patterns distinguishing acrolein (ACR) treated zebrafish from controls. Top twenty up-regulated and down-regulated pathways based on GOBP enrichment analysis of RNA-Seq results in WT and WT & ACR zebrafish larvae at 5 dpf. GOBP, Gene Ontology Biological Process; dpf, day post fertilization. |

Disrupted motor neuron development in acrolein (ACR) treated zebrafish embryos. (A) Representative confocal images of motor nerves. White scale bar: 20 μm. (B,C) Quantification of average length of motor nerves showed significant decrease of axonal length in embryos upon ACR treatment at 24 and 48 hpf. n = 9–11. For statistical analysis Student’s t-test was applied; ****p < 0.0001. hpf, hour post fertilization. |
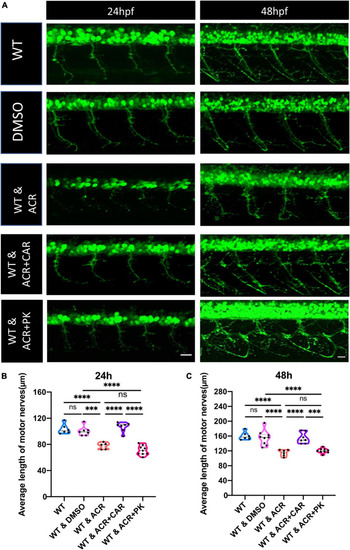
Beneficial effects of anti-acrolein (ACR), but not hypoglycemic treatment on motor neuron development in ACR treated embryos. (A) Representative confocal images of motor neurons at 24 and 48 hpf upon different treatment. White scale bar: 20 μm. (B,C) Quantification of average length of motor nerves showed significant decrease of axonal length in embryos upon ACR treatment can be well-reversed by L-carnosine (anti-ACR treatment) but not PK11195 (hypoglycemic treatment) at 24 and 48 hpf. n = 5–9. For statistical analysis one-way ANOVA followed by Tukey’s multiple comparisons test was applied. ***p < 0.001, ****p < 0.0001. ns, not significant; hpf, hour post fertilization. |

RNA-Seq data displayed up-regulated ferroptosis in acrolein (ACR) treated zebrafish larvae at 5 dpf. (A) Heatmap showed relative mRNA expression in ferroptosis biological process. (B) RNA-Seq GSEA analysis showed up-regulated expression of ferroptosis in ACR treated zebrafish larvae. The higher and lower expression level is showed in red and purple, respectively. GSEA, gene set enrichment analysis; dpf, day post fertilization. |

Motor neuron development under ferroptosis inducer and ferroptosis inhibitor treatment. (A) Representative confocal images of motor nerves at 24 and 48 hpf upon different drugs treatment. White scale bar: 20 μm. (B,C) Quantification of average length of motor nerves showed significant decline of axonal length in embryos upon ferroptosis inducer Erastin treatment. The ferroptosis inhibitor Ferrostatin can reverse the impaired motor neuron development in Erastin and acrolein (ACR) treated embryos at 24 and 48 hpf. n = 9–16. For statistical analysis one-way ANOVA followed by Tukey’s multiple comparisons test was applied. ****p < 0.0001. ns, not significant; hpf, hour post fertilization. |
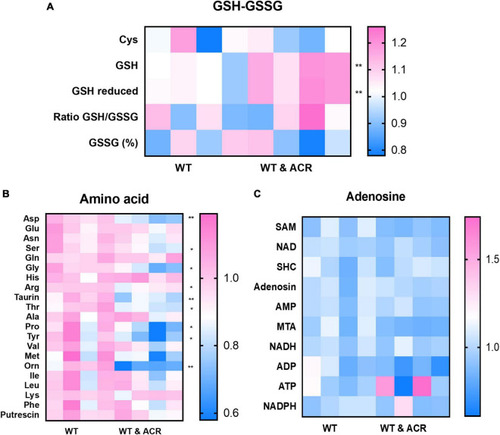
Metabolomic screening displayed several alterations in acrolein (ACR) treated zebrafish larvae at 5 dpf. (A–C) Heatmaps showed the metabolomic screening of thiols panel (A), amino acids panel (B) and adenosines panel (C) in WT and WT & ACR zebrafish larvae at 5 dpf: panel (A) Glutathione (GSH) and reduced GSH showed significant increase in WT & ACR zebrafish; panel (B). Several amino acids displayed significant reduction after treatment with ACR; panel (C). No changes in adenosine levels were identified in WT & ACR larvae as compared to WT larvae; n = 4 clutches with 50 larvae, for statistical analysis Student’s t-test was applied; *p < 0.05, **p < 0.01. dpf, day post fertilization. |