
- Title
-
Zebrafish aversion to infrasound in an open field test
- Authors
- Scatterty, K.R., Pitman, T., Eckersley, T., Schmaltz, R., Hamilton, T.J.
- Source
- Full text @ Front. Behav. Neurosci.
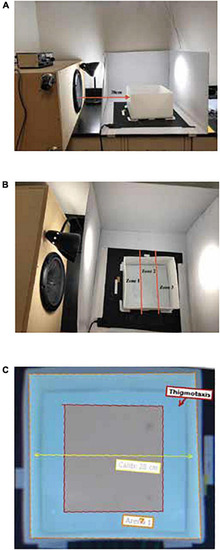
Infrasound speaker placement and EthoVision XT digital zone layouts in the open field test. (A) Infrasound speaker placement of 38 cm to the left of the testing arena. (B) Location preference zones by distance from the infrasound source (Zone 1 = Speaker; Zone 2 = Middle; Zone 3 = Far). (C) Thigmotaxis zone measured 4.8 cm from the water line of each arena wall. |
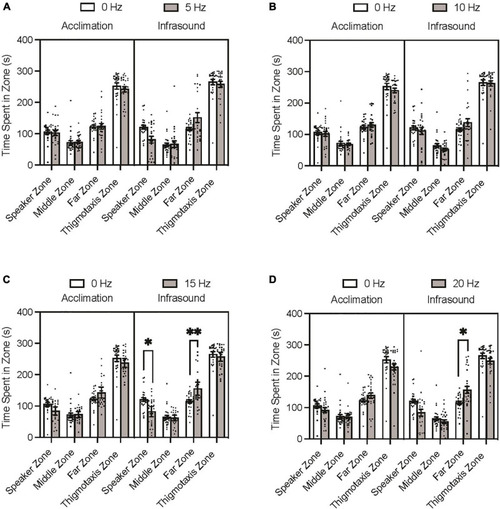
Zebrafish zone preference during acclimation and infrasound exposure trials. Fish were individually placed in the arena prior to the infrasound stimulus to record their baseline behaviour and then exposed to their respective frequency. (A) Average time spent in zones by 0 vs. 5 Hz fish. (B) Average time spent zones by 0 vs. 10 Hz fish. (C) Average time spent in zones by 0 vs. 15 Hz fish. (D) Average time spent in zones by 0 vs. 20 Hz fish. Data points represent individual zebrafish. Error bars represent S.E.M. *p < 0.05, **p < 0.01. |
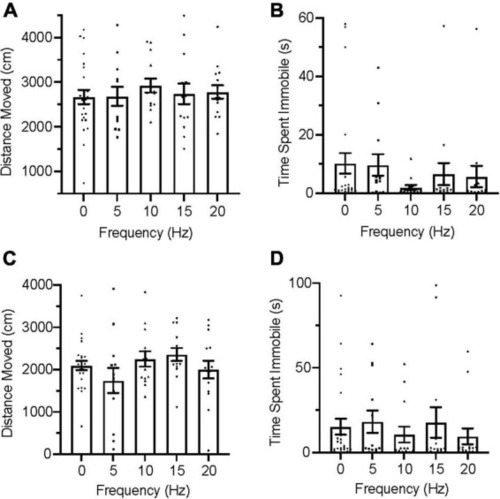
Zebrafish locomotion during acclimation and infrasound exposure. (A) Average distance moved during the acclimation period. (B) Average time spent immobile during the acclimation period. (C) Average distance moved during infrasound exposure. (D) Average time spent immobile during the infrasound exposure period. Data points represent individual zebrafish. Error bars represent S.E.M. |