
- Title
-
Loss of the crumbs cell polarity complex disrupts epigenetic transcriptional control and cell cycle progression in the developing retina
- Authors
- Owen, N., Toms, M., Tian, Y., Toualbi, L., Richardson, R., Young, R., Tracey-White, D., Dhami, P., Beck, S., Moosajee, M.
- Source
- Full text @ J. Pathol.

The effect of crb2a−/− on retinal neurogenesis and lamination. Characterisation of cell types present in zebrafish retina at 56 hpf (A–H, wild type zebrafish, A′-H′ crb2am289 zebrafish). Early retinal progenitor cells were identified through staining with pax6 in WT (A and B) and crb2a−/− (A′ and B′) and anti-vsx2 (C, D, C′ and D′) at 56 hpf. Anti-ZPR1 antibody (zpr1) was used to identify the presence of cone cells (E and F) in WT; however these were absent from the mutant retina (E′ and F′) at 80 hpf. The presence of Müller cells was visualised using an anti-glutamate synthetase antibody (GS) in WT (G and H) and mutant (G′ and H′) retina. M-phase nuclei, visualised using an anti-phospho-Histone 3 antibody (PH3), were observed in both WT (I) and crb2a−/− (J) at 56-hpf. All nuclei are stained with DAPI. S-phase nuclei as visualised by 5-ethynyl-2’-deoxyuridine (EdU) incorporation were observed in WT (I′) and crb2a−/− (J′) retina. Panels I″ and J″ are merged images of previous panels. (K) Quantification of PH3-positive cells; *** p < 0.001. Scale bar, 50 μm.
|

Retinal organoids of a CRB1 patient. Clinical retinal imaging of a patient with CRB1-LCA8 and generation of ROs from patient-derived hiPSC. (A) Schematic of retinal differentiation 2D/3D protocol from hiPSC. (B) Fundus photograph, (C) fundus autofluorescence, and (D) retinal imaging using spectral domain-optical coherence tomography of right eye of patient with CRB1-LCA8. The nasal outer macula subfield was 414 μm thick with no signs of any oedema. Immunostaining images of WT and CRB1 RO sections at day 35 for (E) PAX6/VSX2, (F) PH3/VSX2, (G) BRN3A/VSX2, and (H) MPP5/VSX2 expression. (I) Quantification of PH3-positive cells per section analysed; * p < 0.02. Scale bars: A, 100 μm; D, 200 μm; E–H, 50 μm.
|

Gene ontology (GO) overrepresentation analysis of differentially expressed genes in crb2a−/− retina. Scatter plots of ontology enrichment analysis coloured by log10(p-value) scores plotted in semantic space. The size of each point represents the number of genes overlapping the ontology, scaled. Multidimensional scaling (MDS) was used to reduce the dimensionality of the resulting GO terms’ semantic similarities, with the closeness in the plot reflecting the closeness in the GO directed acyclic graph structure. Thus, semantically similar terms should remain close together in the plot. (A) Biological process (GO:BP) ontology analysis, (B) molecular function (GO:MF) analysis, (C) cellular component (GO:CC), and (D) REACTOME pathway analysis.
|
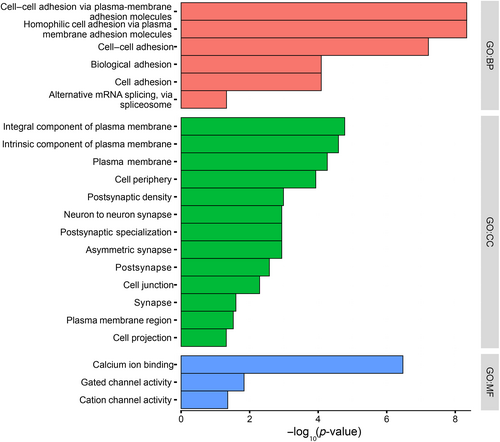
Ontology enrichment analysis of differentially methylated genes (DMGs). Enriched GO analysis of DMGs identified for biological process (BP), cellular compartment (CC), and molecular function (MF).
|
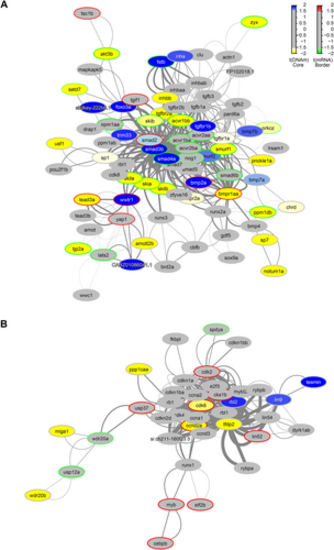
Functional PPI networks. The differentially methylated modules consist of a network of genes based on their functional connectivity using PPI. Each module has a primary gene that is connected to other target genes in the network. Each module was significant p < 0.05 using the Functional Epigenetic Module method. GraphNEL networks were exported from the modified FEM R package to Cytoscape (version 3.8) using RCy3 and further annotated. Node colour represents methylation state; blue nodes show hypermethylation, with yellow representing hypomethylation. A different colour of the node border refers to differential expression; those with red borders are upregulated, those with green are downregulated. Edge widths are proportional to the average statistic of the PPI network. (A) The bmpr1aa/smad3b/smad4a module is associated with BMP and TGFβ signalling pathways and was reported to be significant through three different seed genes. (B) The tfpd2/cdk6 module is associated with cell cycle regulation, identified twice with individual seed genes.
|

Unillustrated author statements PHENOTYPE:
|