
- Title
-
A molecular network of conserved factors keeps ribosomes dormant in the egg
- Authors
- Leesch, F., Lorenzo-Orts, L., Pribitzer, C., Grishkovskaya, I., Roehsner, J., Chugunova, A., Matzinger, M., Roitinger, E., Belačić, K., Kandolf, S., Lin, T.Y., Mechtler, K., Meinhart, A., Haselbach, D., Pauli, A.
- Source
- Full text @ Nature
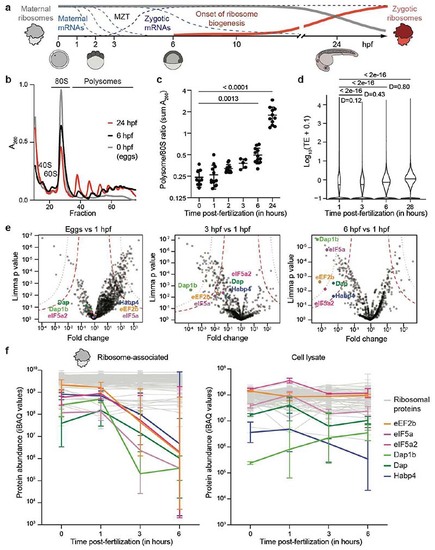
Translation increase during zebrafish embryogenesis anti-correlates with the presence of ribosome-bound factors.
a, Schematic of the maternal-to-zygotic transition (MZT). Clearance of maternal mRNAs is coordinated with the activation of transcription during the first hours post-fertilization (hpf). In zebrafish, replacement of maternal by zygotic ribosomes takes several days. b, Representative zebrafish polysome profiles. A260, absorbance at 260 nm. c, Quantification of polysome-to-monosome ratios (0 hpf: n = 9; 1 hpf: n = 13; 2 hpf: n = 13, 3 hpf: n = 5; 6 hpf: n = 12; 24 hpf: n = 11). Significance was determined with Kruskal-Wallis and Dunn’s two-sided test. Data are mean ± standard deviation (SD). d, Violin plots showing the distribution of the median translation efficiency (TE) during embryogenesis. Significance was assessed by the two-sided Wilcoxon pairwise test and effect size was estimated by Cohen’s D58 (< 0.2: “negligible”; [0.2-0.5]: “small”; [0.5-0.8]: “medium”; > 0.8: “large”). e, Volcano plots based on mass spectrometry data showing fold enrichments of proteins in the ribosome fraction of 1 hpf embryos compared to eggs (left), 3 hpf (middle) and 6 hpf (right) embryos (n = 3 for each time-point). All significantly enriched or depleted proteins are listed in Supplementary Table 1. Permutation-based false discovery rates (FDRs) are displayed as dotted (FDR < 0.01) and dashed (FDR < 0.05) lines. f, Abundance changes of a subset of factors relative to ribosomal proteins in the ribosome-associated proteome (left) and cell lysate (right) (n = 3). Abundances are reported as iBAQ values. 74 ribosomal proteins are plotted in grey. Error bars correspond to geometric SD. For c, e and f, n are biologically independent samples. |
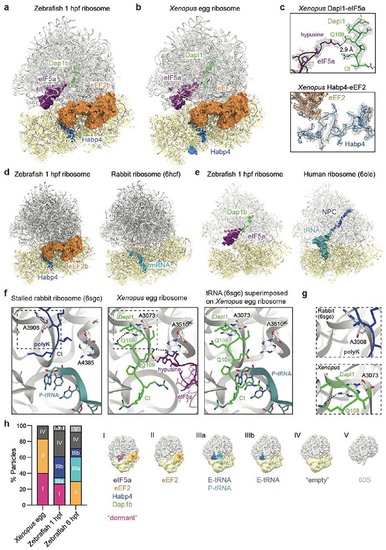
A conserved set of factors blocks functionally important sites of the egg ribosome.
a-b, Overview of the dormant ribosome structure from 1 hpf zebrafish (a) and Xenopus egg (b). Ribosome-associated factors are shown as surface representations; eEF2b and eIF5a correspond to PDB-6MTE18 and PDB-5DAT. c, Density maps (in mesh) of the two modules of the Xenopus dormant ribosome. d, Habp4 and eEF2b (6MTE18) are shown as surface representations in the zebrafish dormant ribosome (left). A rabbit ribosome stalled on an mRNA (6HCF59) is shown for comparison (right). e, Clipping of the zebrafish dormant ribosome shows eIF5a (5DAT) and Dap1b bound within the polypeptide exit tunnel (left). The structure of a stalled human ribosome (6OLE60) containing a nascent polypeptide chain (NPC) and a P/E-tRNA is shown for comparison (right). f, Comparison of the peptidyl-transferase center of a rabbit 80S ribosome stalled with a poly-Lysine NPC and a P/E-tRNA (6SGC61, left) and of the Xenopus dormant ribosome (middle). For comparison, the P/E-tRNA (6SGC61), absent in dormant ribosomes, was superimposed onto the Xenopus egg ribosome (right; eIF5A is hidden). Critical amino acids and 28S rRNA nucleotides are labeled; interactions are depicted with dashed lines. Boxed areas are shown at higher magnification in g. g, A3073 of Xenopus 28S rRNA (bottom; equivalent to A3908 of rabbit 28S, top) displays a different conformation when interacting with Gln108 of Dapl1. h, Distribution of ribosomal particles among the classes obtained with cryoDRGN48. Representative filtered maps of the major classes are shown (Extended Data Fig. 3g, h; Supplementary Table 3; n.a refers to “non-assigned” particles). Ct, C-terminus. |
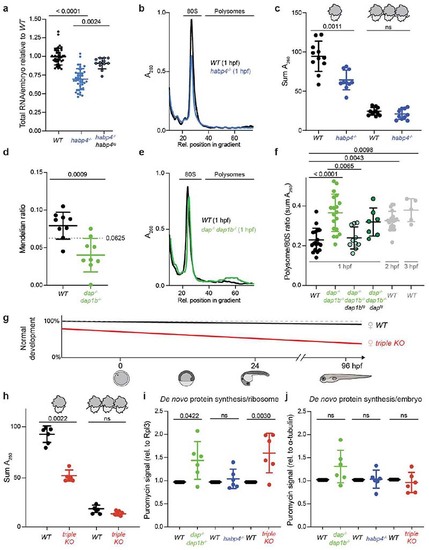
Habp4 stabilizes monosomes, while Dap1b/Dap represses translation in embryos.
a, RNA isolated from wild-type (WT), habp4-/- and transgenic habp4-/- embryos expressing Habp4 (habp4-/-, habp4tg) (WT: n = 40; habp4-/-: n = 40; habp4-/-, habp4tg: n = 12). b, Representative polysome profiles from WT and habp4-/- embryos at 1 hour post-fertilization (hpf). A260, absorbance at 260 nm. c, Quantification of monosomes and polysomes from 1 hpf embryos (WT: n = 11; habp4-/-: n = 10). d, Mendelian ratio analysis of fin-clipped adult fish. Adult dap-/-, dap1b-/- and WT fish are expected at 6.25% from a dap+/-, dap1b+/- incross (n = 9 independent crosses; heterozygous combinations are not shown; total number of fish genotyped: 1029). e, Representative polysome profiles from 1 hpf WT and dap-/-, dap1b-/- embryos. f, Quantification of polysome-to-monosome ratios of 1 hpf embryos derived from WT, dap-/-, dap1b-/-, and transgenic dap-/-, dap1b-/- expressing Dap or Dap1b (WT, 1 hpf: n = 18; dap-/-, dap1b-/-: n = 19; dap-/-, dap1b-/-, daptg: n = 7; dap-/-, dap1b-/-, dap1btg: n = 10; WT, 2 hpf: n = 21; WT, 3 hpf: n = 5). g, Scheme of the percentage of WT and dap-/-, dap1b-/-, habp4-/- (triple KO) embryos that developed into larvae (Extended Data Fig. 8g-j). h, Quantification of monosomes and polysomes from 1 hpf embryos (n = 6 per genotype; representative profile in Supplementary Fig. 1j). i-j, Quantification of protein synthesis rates normalized to Rpl3 (i) or alpha-Tubulin (j) (n = 6 per genotype; Supplementary Fig. 1l; for uncropped images of membranes see Supplementary Fig. 2c). For a, c, f and h-j, n are biologically independent samples. In a, c, d, f and h-j, data are scatter dot plots with mean ± standard deviation (SD); ns, not significant. Statistical analysis was performed with Kruskal-Wallis followed by Dunn’s two-sided tests (a, f), two-sided Mann-Whitney (c, d, h), and one-way ANOVA followed by one-sided Tukey’s multiple comparisons test (i, j). |
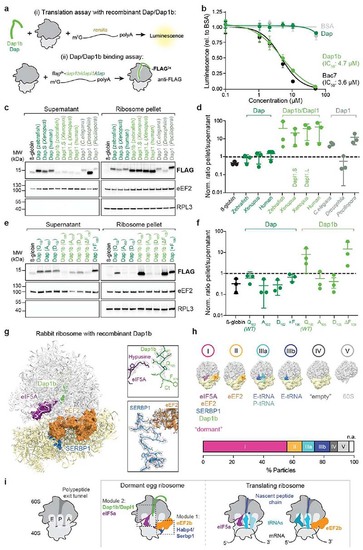
Dap1b/Dapl1 binding to mammalian ribosomes blocks translation and reconstitutes the egg-like dormant ribosome state.
a, Scheme of the assays performed in rabbit reticulocyte lysate (RRL). (Top) Recombinant zebrafish Dap or Dap1b and in vitro synthesized renilla mRNA were added to RRL. Translation was assessed by measuring Luciferase activity. (Bottom) In vitro synthesized mRNAs encoding FLAG-tagged proteins were translated in RRL. Ribosomes were pelleted and proteins were quantified by Western blot. b, IC50 analyses of Dap1b and Dap (a, top). Bac7 and BSA were used as controls (n = 4; plot shows mean ± standard deviation (SD)). c, Ribosome binding assays of in vitro translated proteins (a, bottom). β-globin was used as control. eEF2 and RPL3 were used as a readout of fractionation and for normalization. Total reaction is shown in Extended Data Fig. 9a. d, Quantification of the blots shown in c. Values are normalized to loading (eEF2 or RPL3) and levels of the FLAG-tagged factors (n = 3). e, Ribosome binding assays with β-globin (control), wild-type and mutant versions of zebrafish Dap and Dap1b. Total reaction is shown in Extended Data Fig. 9b. f, Quantification of the blots shown in e (n = 3). g, Structure of the rabbit ribosome with zebrafish Dap1b. Ribosome-associated factors are shown as surface representations. Densities (in mesh) are shown on the right. Critical amino acids are indicated. Ct, C-terminus. h, Distribution of ribosomal particles from RRL among the classes obtained with cryoDRGN48. Representative filtered maps of the major classes (top) with superimposed colored densities for eEF2, eIF5A and tRNAs (Supplementary Table 3; n.a refers to “non-assigned” particles). i, Scheme depicting the main features of the dormant ribosomes identified in this study. (Left) Cartoon of important functional sites of the ribosome. (Middle) Dormant ribosomes are associated with four factors. (Right) Translating ribosomes. For b, d and f, n are independent experiments. In d and f, data are scatter plots with mean ± SD, and statistical analysis was performed with Kruskal-Wallis followed by Dunn’s two-sided test. Uncropped images of membranes shown in c and e are provided in Supplementary Fig. 2a, b. |