
- Title
-
A minimally invasive fin scratching protocol for fast genotyping and early selection of zebrafish embryos
- Authors
- Venditti, M., Pedalino, C., Rosello, M., Fasano, G., Serafini, M., Revenu, C., Del Bene, F., Tartaglia, M., Lauri, A.
- Source
- Full text @ Sci. Rep.
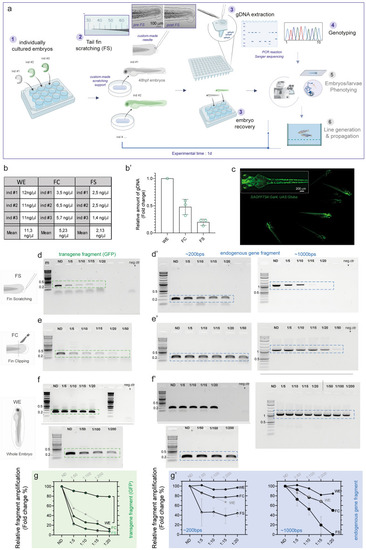
Caudal fin scratching protocol in 48 hpf zebrafish embryos allows sufficient genomic DNA extraction and genotyping. (a) Schematics of the general workflow to obtain genomic DNA (gDNA) from the tail fin scratching (FS) of individually cultured zebrafish embryos at 48 hpf. The single embryo are cultured in separated well plates (1); gentle tail fin scratching and tissue collection is performed on anesthetized embryos by using custom-pooled glass capillaries and a custom-made agarose-based support where fish are positioned (2); the tip of the capillary containing the collected tissue material is recovered and the samples are immediately processed to extract crude gDNA, while fish are recovered after the procedure (3); genotyping analyses are performed on the gDNA (4), while recovered embryos can immediately be used for morpho-functional phenotyping (5) and/or fish line generation and propagation (6). In step 2, a close-up of a representative custom-pooled needle with a reference scale. Insets on the right show representative bright field images of a single embryo before (pre-FS) and after (post-FS) the completion of the FS procedure. The extend of tissue removal after the procedure is shown in the dashed blue circle in post FS. (b, b′) Quantitative comparison of the yield of FS-, FC- and WE-derived gDNA from single embryos. Raw values from three different embryos (ind #) are shown in the table in b, the data are plotted as fold change relative to gDNA amount collected from WE-derived method in b’. The mean ± SEM from three individual embryos is shown. (c) Representative fluorescent image showing Tg(SAGFF73A:Gal4;UAS:Gtuba) embryos at 48 hpf, where green fluorescent protein (GFP) marks the ubiquitous expression of tubulin protein. A higher magnification on one of the embryos is shown in the inset on the top left. (d, d′) PCR results of fragment amplification of target GFP (d) and of endogenous gene fragment (d′) of approximately 200 bps (left) and 1000 bps (right) in length using non diluted (ND) or a series of dilutions of the original FS-derived gDNA from a single 48hpf embryo. (e–f′) PCR results of the same targets as in (d, d′) obtained by FC (e, e′) or by WE (f, f′) method from one single experiment. In each experiment a negative control (neg ctr) was added. One negative control was run for the PCR belonging to the same experiment (e and f or d′–f′ for 200 bps). Different gels in (f) are demarcated by a black line. For each procedure (FS, FC and WE), a comparative schematic is shown on the left. For FS, a representative PCR result is shown from three (d) and two (d′, left and right) independent experiments. For FC and WE, the single PCR performed is shown in (e, e′) left panel and (f) and (f′) left panel (200 bps band). A representative result from two independent experiments is shown in e’ and f’ right panel (1000 bps band). (g–g′) Plot showing the quantification and the relative amount of fragment amplification for GFP (g) and endogenous control gene fragments (g′) resulting from PCR reactions using different dilutions of the FS-, FC- and WE- derived single embryo gDNA. Values representing the relative quantification of the target amplicons from different dilutions derive from densitometric analysis of the PCR bands visible on agarose gel and are plotted as percentage changes compared to the WE-derived not diluted sample. FS data are expressed as mean ± SEM of the replicates as indicated above. m = molecular marker (Quick-Load® 1 kb Plus DNA Ladder, NEB #N0469S), the bands of 0.2, 0.5 and 1 kb are indicated. Source data are provided as a Source Data file. |
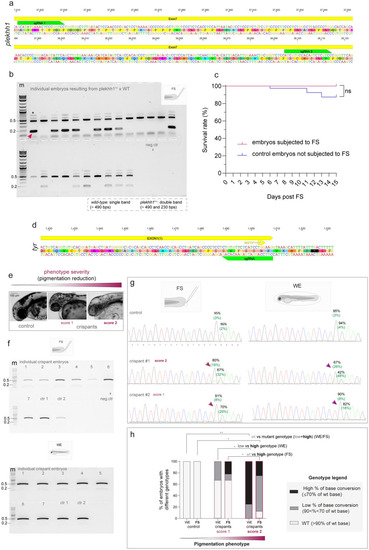
Efficient genotyping of 48 hpf transient and stable CRISPR-Cas mutants using genomic DNA derived from the FS protocol (a) Schematics of the zebrafish genomic sequence showing the position of guide-RNAs used to generate the plekhh1 mutant line. (b) PCR result showing the possibility of genotype segregation using the FS-derived gDNA of single embryos from the offspring of plekhh1 mutants outcrossed with WT fish. A fragment of the plekhh1 exon targeted by CRISPR-Cas is amplified. Wild-type (single band, ~ 493 bps) are discernable from heterozygous plekhh1+/- mutants (double band, ~ 493 and 230 bps, red arrowhead). The asterisk shows not specific bands. The agarose gel shows the result of a single PCR experiment. (c) Survival rate of embryos subjected to FS compared to control individuals from the same clutch, which were not subjected to FS. Log-rank (Mantel Cox) test is used to assess the statistical significance between groups (ns = not significant). Data show the survival rate from a single experiment with n = 40 control embryos non subjected to FS and 24 embryos subjected to FS. (d) Schematics of the zebrafish genomic sequence showing the position of the guide-RNA used to generate the tyr crispant with the base conversion (C > T, here G > A on the complement strand) leading to W273*. (e) Representative phenotypes showing partially (score 1) or severely (score 2) depigmented crispant mutants at 48hpf obtained upon tyr base editing. Reduced melanin content is apparent compared to a not-injected control sibling shown on the left. The images are representative of embryos from a single batch. (f) PCR results showing successful amplification on different crispants of a target fragment surrounding the edited tyr exon using the FS-derived gDNA (upper panel). Amplification of the same target sequence obtained by the gDNA extracted from the remaining WE tissue of the same individuals is shown in the lower panel. The agarose gel shows the result of a single PCR experiment. For both FS and WE two not-injected controls (ctr1 and ctr2) are also shown. (g) Examples of chromatograms resulting from Sanger sequencing of amplicons from WE- and FS- derived gDNA of the same tyr base edited crispants at 48 hpf. Examples of the performance of FS compared to WE for score 1 and score 2 are shown. Visible base conversion (here G > A) leading to a premature STOP codon is indicated by a purple arrow. Percentage of conversion G > A (C > T) and of residual G were calculated by EditR and are shown in green and black, respectively. A representative WT chromatogram from a non-injected sibling is also show on the top as negative control. m = molecular marker (Quick-Load® 1 kb Plus DNA Ladder, NEB #N0469S), the bands of 0.2 and 0.5 kb are indicated. (h) The bar graph shows the genotype–phenotype correlation obtained by WE or FS-derived genotyping. Incidence (%) of sequences from tyr crispant embryos of different severity obtained by WE or FS exhibiting altered genotype (low or high rate of base conversion) compared to WT controls. N = 2 (controls), 9 for score 1 and 8 for score 2. Two-sided Chi-square’s test in 2 × 2 contingency table (WT vs. altered genotypes) are used to assess statistical significance between the different groups. Adjusted P values are reported (*p < 0.05, **p < 0.01). Source data are provided as a Source Data file. |