
- Title
-
Human JAK1 gain of function causes dysregulated myelopoeisis and severe allergic inflammation
- Authors
- Biggs, C.M., Cordeiro-Santanach, A., Prykhozhij, S.V., Deveau, A.P., Lin, Y., Del Bel, K.L., Orben, F., Ragotte, R.J., Saferali, A., Mostafavi, S., Dinh, L., Dai, D., Weinacht, K.G., Dobbs, K., Ott de Bruin, L., Sharma, M., Tsai, K., Priatel, J.J., Schreiber, R.A., Rozmus, J., Hosking, M.C., Shopsowitz, K.E., McKinnon, M.L., Vercauteren, S., Seear, M., Notarangelo, L.D., Lynn, F.C., Berman, J.N., Turvey, S.E.
- Source
- Full text @ JCI Insight

Sustained clinical improvement of JAK1GOF patients on ruxolitinib.
(A) Decline in both IgE level and skin prick test sizes in patient III-1 following ruxolitinib treatment. (B) Affected patients showed severe elevations in total WBC count, followed by normalization with ruxolitinib. Hemoglobin levels were normal/elevated prior to ruxolitinib, after which they remained on the lower limit of normal/mildly low. Platelet counts remained within the normal range; however, they were higher in number on ruxolitinib treatment. Ruxolitinib therapy dramatically improved eosinophil counts; however, they remained above the normal upper limit (0.5 × 10⁹/L). (C) Growth charts of patients III-I and III-2 carrying the JAK1GOF variant before and after treatment with ruxolitinib. |

JAK1GOF BM and iPSC reveal skewing toward myelopoiesis.
(A) BM biopsy slide obtained from JAK1GOF patient demonstrates an increase in the eosinophil lineage compared with healthy control BM biopsy (Ctrl). Images are at 50× magnification. (B) Representative photographs of JAK1GOF and XY control (Ctrl) iPSCs, demonstrating normal morphology for iPSCs grown in feeder-free culture, including tightly packed iPSCs with well-defined edges. (C) Embryoid body (EB) differentiation of JAK1GOF and Ctrl iPSCs. Images obtained on day 10 of EB differentiation. (D) Representative methylcellulose plates with hematopoietic precursor CFUs, demonstrating increased proportion of hemoglobinized erythroid precursor CFUs in Ctrl compared with JAK1GOF. Experiments represented in B–D were performed 3 times. (E) Decreased proportion of erythroid (CFU-E, BFU-E) CFUs in JAK1GOF compared with Ctrl, with an increased proportion of granulocyte/monocyte precursors (CFU-G, CFU-M, CFU-GM). Average percentage of total CFUs (data presented as mean ± SEM) was compared using a 2-tailed unpaired t test with Welch’s correction. (F) Increased myeloid/erythroid ratio (data presented as mean ± SEM) in JAK1GOF compared with Ctrl using a 2-tailed unpaired t test with Welch’s correction. |

Enhanced Th2 phenotype and T cell activation in JAK1GOF.
(A) Representative flow cytometry plots of healthy controls (Ctrl) and JAK1GOF patient (II-2) Th2, Th17, Th1, and Th1/17 cell subsets as a proportion of live CD3+CD4+ T cells, identified as CCR4+CXCR3–CCR10–CCR6–, CCR4+CXCR3–CCR10–CCR6+, CCR4–CXCR3+CCR10–CCR6–, and CCR4–CXCR3+CCR10–CCR6+, respectively. The red rectangles highlight the cell population gated on for the subsequent plot identified by the red arrow. This experiment was performed twice with patient samples. (B) Average frequency of Th subsets (data presented as mean ± SEM). Subset frequency calculated by multiplying the proportion of each subset by the sample’s number of CD4+ T cells. (C) PCA of Th subset gene expression from whole blood RNA-Seq data. First principal component (PC) values (data presented as mean ± SEM) were compared between groups using 1-way ANOVA with Bonferri multiple comparisons correction. (D) Decreased proportion of naive CD4+ JAK1GOF T cells. Representative flow cytometry of and (E) proportions of naive, effector memory (TEM), effector memory reexpressing CD45RA (TEMRA), and central memory (TCM) CD4+ T cells. This experiment was performed once with patient cells. (F) Increased frequency of IL-4–, IFN-γ–, and IL-17–secreting JAK1GOF CD4+ T cells and IL-4–, IL-9–, and IL-17–secreting JAK1GOF CD8+ T cells (identified as CD3+CD4– T cells) compared with control. (G) Increased IL4 gene expression in expanded and activated JAK1GOF T cells. Measured using qPCR after 4 hours of stimulation with DMSO control, IL-2, and IL-2 plus ruxolitinib (1 mM). Relative gene expression Ctrl and JAK1GOF were calculated using the Livak method (2–ΔΔCt). |

Abnormal gene expression and enhanced cytokine signaling in human JAK1GOF.
(A) PCA of iPSC and whole blood showing clustering of JAK1GOF compared with controls, with JAK1GOF samples from patients following treatment with ruxolitinib shifting closer to controls. Ellipses demonstrating independent clustering are shown for groups containing more than 3 samples. (B) Analysis of differentially expressed genes in human iPSC and whole blood carrying the JAK1GOF demonstrated 43 upregulated and 55 downregulated genes in both iPSC and whole blood compared with controls. (C) Curated list of significantly enriched pathways performed by Reactome Pathway analysis in the 43 upregulated genes found in both human JAK1GOF iPSC and whole blood samples. The y axis indicates Reactome Pathway, and the x axis corresponds to ratio of upregulated genes to the number of genes in each pathway, and the size of each dot corresponds to number of genes identified in samples. Color corresponds to the adjusted P value, with red being more significant. (D) Heatmap of variance-stabilized gene expression values from ontology term groups that were enriched in the shared upregulated genes in human JAK1GOF iPSC and whole blood samples. (E) Waterfall plots of cytokine and cytokine receptors upregulated in human JAK1GOF iPSC and whole blood samples. The y axis corresponds to the log fold change of JAK1GOF compared with controls, and the x axis corresponds to gene name; colors indicate –log(P value), with red being more significant. Whole blood RNA-Seq data obtained from 5 healthy controls, 3 JAK1GOF patients (2 samples each from II-2, III-1, III-2) obtained at different time points before treatment, and 2 JAK1GOF patients (III-1, III-2) after treatment (1 sample from III-1 and 2 samples from III-2 obtained at different time points). iPSC RNA-Seq data were obtained from iPSC-derived EBs on day 7 of differentiation (3 samples each from JAK1GOF and Ctrl, with 50 EBs collected per sample). |

JAK1 transgenic zebrafish generation.
(A) We generated 2 zebrafish lines containing human cDNA for JAK1-WT (JAK1WT) and JAK1-A634D (JAK1GOF). Ubi is a ubiquitous promoter driving expression of JAK1 and the green fluorescent protein (GFP). Constructs were microinjected into 1-cell stage zebrafish embryos. GFP+ fish were selected. (B) Different doses of ruxolitinib were tested to determine the optimal dose for the survival for both transgenic fish lines. Ruxolitinib (1 μM) was selected based on higher survival levels for all 3 transgenic lines. Survival was compared between groups (JAK1WT and JAK1GOF transgenic and uninjected zebrafish) (P < 0.0001) and was also compared across varying doses of ruxolitinib in JAK1GOF transgenic zebrafish (P < 0.0001) using 2-way repeated-measures ANOVA. (C) F1 embryos from JAK1GOF founders with transgene expression exhibited abnormal development, which was rescued upon exposure to ruxolitinib, revealing a conserved functional developmental impact of JAK1GOF in the zebrafish. The remaining percentages correspond to GFP-negative zebrafish. (D and E) Representative pictures of 30 hpf JAK1GOF-injected zebrafish, with normal and abnormal development. PHENOTYPE:
|

Characterization of the hematological phenotype of the human JAK1WT and JAK1GOF transgenic fish lines.
(A) Whole-mount in situ hybridization (WISH) using digoxigenin-labeled RNA antisense probes for stem cells and differentiated myeloid cells in zebrafish embryos of JAK1WT and JAK1GOF transgenic genotypes. A panel of representative micrographs shows runx1/c-myb staining for hematopoietic stem cells at 48hpf, pu.1 staining for early myeloid cells at 28 hpf, mpx staining for neutrophils at 48 hpf, and cpa5 staining for mast cells at 48 hpf. Total numbers of imaged and quantified embryos are shown on the representative images, and arrowheads indicate main sites of marker expression. (B) Plots of marker-positive cell counts for runx1/c-myb at 48 hpf, pu.1 at 28 hpf, and mpx and cpa5 at 48 hpf. Each individual embryo count is indicated by a filled circle, and the box plot shows quartile distribution with whiskers covering 95% CI. Black circles denote location of outlier counts. One-way ANOVA was used to quantify the statistical differences between the groups. ***P ≤ 0.001; ****P ≤ 0.0001. |
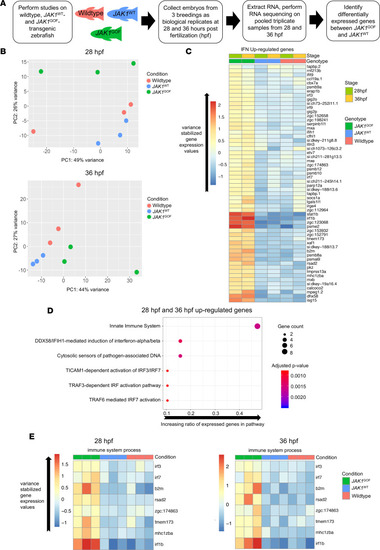
RNA-Seq of uninjected zebrafish and human JAK1WT and JAK1GOF transgenic zebrafish reveals a distinct transcriptomic pattern associated with JAK1GOF (p.A634D).
(A) Description of steps involved in the RNA-Seq experiment aimed at identifying genes specifically induced by JAK1-A634D (JAK1GOF) in zebrafish embryos. After performing standard sample collection and RNA-Seq steps, the main comparison at the analysis stage was between JAK1WT and JAK1GOF samples. (B) PCA of 28 and 36 hpf data sets consisting of WT, JAK1WT, and JAK1GOF samples. The plots shown contain the first 2 components (PC1, PC2) and identify clear differences between JAK1GOF samples and JAK1WT or uninjected samples at 28 hpf. (C) Heatmap of average variance-stabilized gene expression values for IFN-stimulated genes that are present among the genes upregulated by JAK1GOF in at least 1 stage analyzed (28 and 36 hpf) (58 genes) in all analyzed groups of samples. (D) Reactome Pathway analysis of genes upregulated by JAK1GOF shows strong enrichment of immunity-related and DNA damage pathways. Gene ratio is the fraction of the genes in a pathway that were present in the input gene list. Gene count and P values associated with a pathway are indicated by the point size and its color. (E) Heatmaps of average variance-stabilized gene expression values for genes associated with the “immune system process” GO term in all analyzed groups of samples. |

JAK1GOF drives IL-4, IL-13, and IFN signaling across species.
(A) Diagrammatic explanation of analysis pipeline for comparing differential gene expression between zebrafish, induced pluripotent stem cells (iPSC), and human whole blood. (B) Analysis of differentially expressed orthologous genes identified 25 genes that were common between human JAK1GOF iPSCs, human JAK1GOF whole blood, and JAK1GOF transgenic zebrafish. (C and D) Reactome Pathway analysis and STRING protein-to-protein interactions of the 25 differentially expressed genes in JAK1GOF-affected patients, iPSCs, and transgenic zebrafish reveals significantly enriched protein-to-protein interactions, as well as IFN and IL-4/IL-13 signaling. The 5 most significantly upregulated Reactome Pathways are displayed in C. The y axis indicates Reactome Pathway, and the x axis corresponds to ratio of upregulated genes to the number of genes in each pathway; the size of each dot corresponds to number of genes identified. Color corresponds to the adjusted P value with red being more significant. The upregulated Reactome Pathway corresponding proteins are annotated in D, revealing the shared expression of SOCS proteins in both IFN and IL-4/IL-13 signaling. |