
- Title
-
Tilt In Place Microscopy (TIPM): a simple, low-cost solution to image neural responses to body rotations
- Authors
- Hamling, K.R., Zhu, Y., Auer, F., Schoppik, D.
- Source
- Full text @ J. Neurosci.
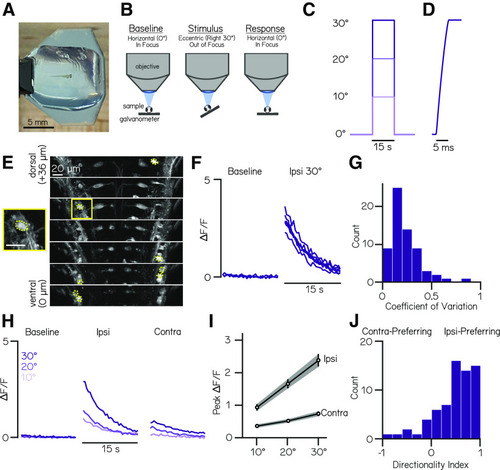
TIPM produces reliable, directional, and magnitude-dependent responses following roll tilts. A, A 4 dpf larval zebrafish mounted in agarose for roll stimuli on a mirror galvanometer. B, Schematic of our experimental paradigm. Baseline fluorescence (used for normalization) is measured when the platform is horizontal. The galvanometer is then stepped and held at an eccentric angle (Stimulus) where fluorescence is not recorded, then quickly returned to horizontal, whereupon fluorescent recording begins (Response). C, Voltage trace from galvanometer during a 10, 20, and 30° step to the left. D, Feedback voltage from the galvanometer during a step to 30°. E, Slices from a two-photon volume of Tg(nefma:GAL4);Tg(UAS:GCaMP6s) fish. Dashed yellow overlays indicate pixels that correspond to analyzed vestibulospinal neurons. Yellow square shows close-up of a single analyzed cell. Scale bar, 20 µm. F, Normalized fluorescence traces for all trials of one neuron during baseline and response to an ipsilateral 30° roll. G, Distribution of coefficients of variation of peak ΔF/F values across 30° step trials for responsive neurons (n = 69 neurons). H, Mean normalized fluorescence traces for one neuron during baseline and response to ipsilateral and contralateral roll steps of varying magnitudes (10, 20, 30°). I, Mean peak ΔF/F responses across all responsive neurons for ipsilateral and contralateral rolls of 10, 20, and 30° magnitudes. Error bars indicate ± SEM. J, Distribution of directionality indices (see above, Materials and Methods) across all responsive neurons. |

Variability in responses arises predominantly from intrinsic sources. A, Timeline of an experiment of repeated imaging of the same fish across two mounts on the galvanometer. B, Two-photon volumes of vestibulospinal neurons in a Tg(nefma:GAL4);Tg(UAS:GCaMP6s) larva during two sequential mounting and imaging experiments. Colored overlays indicate the same neurons located in two separate volumes taken across the two mounts. C, Mean fluorescence traces (± SD) during the baseline period and following an ipsilateral roll during the first and second mount for two neurons (orange and blue traces correspond to colored neuron overlays). D, Mean peak response during trials in the first mount experiment are strongly correlated with the mean peak response from the second mount (ρ = 0.83). E, Peak response on a single experimental trial is strongly correlated with peak response on the subsequent trial within the same experiment (ρ = 0.79). |

Responses after a step back to horizontal from an eccentric angle are strongly correlated with activity before the step. A, Schematic of stimuli used to compare responses after return to horizontal (black) to responses at the eccentric angle (magenta). Solid lines indicate stimulus periods where neurons are in focus, and dashed lines indicate stimulus periods where neurons are out of focus. B, Concatenated traces of mean normalized fluorescence responses (± SD) before, during, and after a ipsilateral roll step of 30° for two example neurons with differing response temporal dynamics (fast decay on left, slow decay on right). C, The mean fluorescence during the last second of the eccentric step is strongly correlated with the mean fluorescence during the first second on return to horizontal for all neurons (n = 26 neurons; ρ = 0.94). Example fast- and slow-decay neurons in B identified with a star and square. D, Distribution of calcium response decay slopes during the eccentric step for all neurons. E, Distribution of times-to-peak normalized fluorescence during the eccentric step for all neurons. |

Ventral vestibulospinal neurons respond to impulse stimuli in a nondirectional, magnitude-independent manner. A, Voltage trace corresponding to feedback from galvanometer during a 10, 15, and 30° impulse step to the left. B, Feedback trace during the impulse step to 30°. C, Normalized fluorescence traces for all trials of one neuron during baseline and response to an ipsilateral 30° impulse step. Note the lower scale on the vertical axis relative to Figures 1–3. D, Distribution of coefficients of variation of peak fluorescent intensity across 30° step trials for responsive neurons (n = 22 neurons). E, Mean normalized fluorescence traces for one neuron during baseline and response to an ipsilateral and contralateral impulse step of varying magnitudes (10, 20, 30°). F, Mean peak ΔF/F responses across all responsive neurons for ipsilateral and contralateral impulse steps of 10, 15, and 30° magnitudes. Error bars indicate ± SEM. G, Distribution of directionality indices (see above, Materials and Methods) across all responsive neurons. H, Spatial location of impulse-responsive (green) or nonresponsive (gray) vestibulospinal somata relative to the Mauthner neuron lateral dendrite in microns. I, Distribution of dorsoventral position of vestibulospinal neuron bodies relative to the Mauthner lateral dendrite in microns for impulse-responsive (green) and nonresponsive (gray) neurons. Solid lines represent the distribution of all responsive or nonresponsive neurons across all fish. Error bars represent ± 1 bootstrapped SD. |
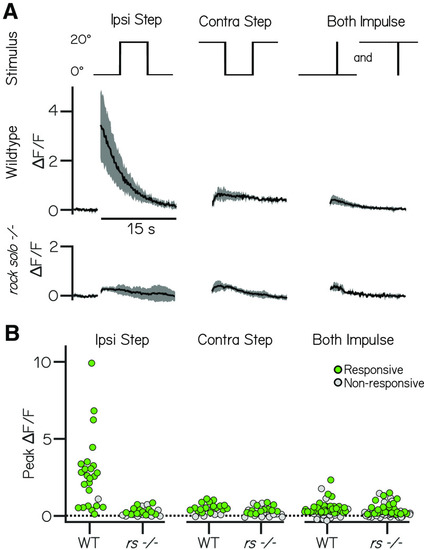
The utricle is indispensable for responses to ipsilateral steps, but not contralateral steps or impulses. A, Example responses (mean ± SD) to 20° step and impulse stimuli (top row) from vestibulospinal neurons in wild-type and rock solo mutants. B, Peak fluorescence responses to ipsilateral step, contralateral step, and impulse steps in both directions in wild-type and rock solo mutants in responsive (green) and nonresponsive (gray) neurons. |

Longitudinal imaging suggests systematic changes in the complement of presynaptic inputs in developing vestibulospinal neurons. A, Two-photon volumes of vestibulospinal neurons in a Tg(nefma:GAL4);Tg(UAS:GCaMP6s) larva during longitudinal imaging experiments at 4 and 7 dpf. Colored overlays indicate the same neurons located in the volume across the two time points. B, Mean peak calcium response of all neurons at 4 dpf are correlated with their mean peak response at 7 dpf (ρ = 0.51) but is more variable than expected by remounting alone (fit line ± SD of residuals from repeated mounting experiment in Fig. 2D). C, Mean peak ΔF/F responses across all responsive neurons for ipsilateral and contralateral rolls of 10, 20, and 30° magnitudes at 4 dpf (black) and 7 dpf (magenta). Error bars indicate ± SEM. D, Probability distributions of longitudinal changes in ipsilateral (top) and contralateral (bottom) calcium response sensitivity (n = 70 cells; see above, Materials and Methods). Dashed vertical lines represent cutoffs for significant sensitivity change. E, Longitudinal sensitivity changes in individual neurons across ipsilateral and contralateral roll tilts. F, Longitudinal sensitivity changes for ipsilateral (top) and contralateral (bottom) roll tilts split by neurons that have significant magnitude-dependent responses to roll steps in that direction at 4 dpf (Early-Tuned, green) versus nontuned at 4 dpf (Non-Tuned, black). |