FIGURE SUMMARY
Title

A DUSP6 inhibitor suppresses inflammatory cardiac remodeling and improves heart function after myocardial infarction

Authors
Zhang, Z., Chen, Y., Zheng, L., Du, J., Wei, S., Zhu, X., Xiong, J.W.
Source
Full text @ Dis. Model. Mech.

BCI ameliorates cardiac injury in post-MI rats. (A) Experimental scheme showing the timing of (E)-2-benzylidene-3-(cyclohexylamino)-2,3-dihydro-1H-inden-1-one (BCI) injections, myocardial infarction (MI) and echocardiography (ECHO) of rats. i.v., intravenous. (B) Representative M-mode tracings from ECHO of sham-operated and vehicle- or BCI-treated groups at 4 weeks post-MI. (C) The BCI treatment group showed improved ejection fraction and fractional shortening compared with the vehicle treatment group, and partially rescued heart function compared with the sham group (n=9–10). (D) BCI treatment improved left ventricle (LV) volumes and LV end-diastolic diameter (LVEDD) compared with vehicle treatment (n=9–10). (E) Masson's trichrome staining showing less fibrosis in BCI-treated hearts than in control hearts at 28 days post-MI (scale bar: 3 mm, n=9–10). (F) High-magnification images of Masson's trichrome and H&E staining showing decreased fibrosis in BCI-treated hearts at 28 days post-MI (scale bar: 300 μm, n=9–10). (G) Quantification of the Masson's trichrome-stained fibrotic area in sham-operated, vehicle-treated and BCI-treated hearts at 28 days post-MI (n=9–10 per group). (H) Immunostaining showing TUNEL+ cardiomyocytes (CMs) in the infarcted zone in sham-operated, vehicle-treated and BCI-treated heart sections at 7 days post-MI. DAPI was used to stain nuclei, and cTnT was used to stain CMs. Scale bar: 100 μm. (I) Percentage of TUNEL+/cTnT+ CMs in each group (n=5 per group). One-way ANOVA followed by Dunnett's multiple comparison test; mean±s.e.m.; *P<0.05, **P<0.01, ***P<0.001; ns, not significant.

BCI has no effect on CM proliferation, H2O2-induced CM death, CM hypertrophy and coronary vessel regeneration. (A) Released lactate dehydrogenase (LDH) was comparable in neonatal rat ventricular myocytes (NRVMs) treated with DMSO or BCI for 24 h in the presence or absence of H2O2 (n=3 per group). (B) Western blots and quantification of Bcl-2 (α-tubulin was used to normalize protein) and p-AKT (AKT was used to normalize protein) in NRVMs treated with DMSO or BCI for 24 h (n=3 per group). (C) Western blots and quantification of H2O2-induced cleaved PARP (α-tubulin was used to normalize protein) and cleaved caspase 3 (total caspase 3 was used to normalize protein) in NRVMs treated with DMSO or BCI (n=3 per group). (D) Immunofluorescent staining showing cTnT+ and pH3+ CMs of sham-operated, vehicle-treated or BCI-treated LV tissues at 7 days after MI (scale bar: 100 μm). (E) Immunofluorescent staining showed that the numbers of either α-actinin+ Ki67+ or α-actinin+ pH3+ CMs were comparable in DMSO- and BCI-treated NRVMs (scale bars: 50 μm; n=3 per group). HPF, high-power field. (F) Immunofluorescent staining and statistics for CD31+ and α-SMA+ vessels of sham-operated, vehicle-treated or BCI-treated LV tissues at 7 days after MI (scale bar: 100 μm; n=3 per group). (G) Wheat germ agglutinin staining and statistics for CM size in sham-operated, vehicle-treated or BCI-treated LV tissues at 28 days after MI (scale bar: 20 μm; n=5 per group). Mean±s.e.m.; ns, not significant.

BCI inhibits macrophage recruitment in infarcted rat hearts and LPS-induced mouse abdominal macrophages. (A) Experimental scheme showing the timing of BCI injections and MI in rats. (B,C) Percentages of His36+ macrophages in the LV of rats at 7 days post-MI by flow cytometry (B) and statistics of His36+ macrophages (C) (n=3 per group; two hearts per sample). (D) Immunofluorescent staining showing decreased numbers of His36+ macrophages (red) in the LV of rats after BCI treatment at 7 days post-MI compared with vehicle treatment (scale bar: 50 μm). (E) The percentage of His36+ macrophages to DAPI+ cells in each group (n=5 per group). (F) The expression levels of Il1b, Il6, Il12b, Retnla, Arg1 and Ym1 mRNAs were determined in sham and MI hearts (day 7) with or without BCI treatment (n=3–4 per group). (G,H) Percentages of lipopolysaccharide (LPS)-induced CD11b+ (also known as ITGAM+) F4/80+ macrophages in mouse abdominal cells were measured by flow cytometry (G), and statistics of CD11b+ F4/80+ cells are shown (H) (n=3 per group; two mice per sample). (I) LPS-induced IL-1β, IL-6 and IL-12 proteins in mouse serum detected by ELISA (n=5 mice per group). One-way ANOVA followed by Dunnett's multiple comparison test; mean±s.e.m.; *P<0.05, **P<0.01; ns, not significant.

BCI inhibits differentiation of BMCs into macrophages. Bone-marrow cells (BMCs) were isolated and cultured from the femurs and tibias of 6-week-old wild-type Sprague-Dawley rats. (A) Bright-field images of BMC-derived macrophages, and the numbers of adherent macrophages in each HPF after 7-day induction by M-CSF in the presence of DMSO or BCI (scale bar: 100 μm; n=3 per group). (B) Numbers of adherent macrophages in each HPF at different time points of BCI treatment (n=3 per group). (C) Expression levels of Egr1, Grb2 and Mnda mRNAs in BMCs at day 3 after M-CSF induction with DMSO or BCI treatment (n=3 per group). (D) Western blots showing DUSP6 expression in M-CSF-induced bone-marrow-derived macrophages (BMDMs) from wild-type (WT) or Dusp6 mutant rats (n=3 per group). (E) Bright-field images of BMC-derived macrophages and the numbers of adherent macrophages in each HPF after 7-day induction by M-CSF from WT or Dusp6 mutant rats (scale bar: 100 μm; n=3 per group). (F) Expression levels of Egr1, Grb2 and Mnda mRNAs in BMDMs at day 3 after M-CSF induction from WT or Dusp6 mutant rats (n=3 per group). (G) RNA-seq showing differential gene expression in myeloid cells at 3 days after M-CSF induction with or without BCI. (H) Kyoto Encyclopedia of Genes and Genomes (KEGG) analysis of genes downregulated by BCI revealed the top 10 affected pathways. (I) Gene Ontology (GO) analysis of genes downregulated by BCI showed ten signaling pathways including cytokines/chemokines. (J) Heatmaps showing the downregulation of cell adhesion molecules, chemokine signaling pathway, growth factor receptor binding and osteoclast differentiation after BCI treatment. One-way ANOVA followed by Dunnett's multiple comparison test; mean±s.e.m.; *P<0.05, **P<0.01, ***P<0.001.

BCI attenuates inflammation through the p38–NF-κB signaling pathway. BMDMs were stimulated by LPS in the presence of DMSO or BCI, and the treated cells were used for qRT-PCR, immunostaining and western blotting. (A) qRT-PCR showing expression levels of LPS-induced Inos, Il1b, Il6, Il12b and Cd14 mRNAs in BMDMs with DMSO or BCI (n=3 per group). (B) qRT-PCR showing expression levels of LPS-induced Mcp1, Ccl4, Ccr2 and Cxcl9 mRNAs in BMDMs with DMSO or BCI (n=3 per group). (C) Western blots and quantification of LPS-induced p-p65 and p65 in BMDMs with DMSO or BCI treatment (n=3 per group). (D) Immunofluorescent staining and quantification of LPS-induced p-p65 (green) in BMDMs with DMSO or BCI treatment (n=3 per group; scale bars: 20 μm). (E) Immunofluorescent staining and quantification of LPS-induced reactive oxygen species measured by dihydrorhodamine 123 (DHR123) (green) in BMDMs with DMSO or BCI treatment (n=3 per group; scale bars: 20 μm). (F-H) Western blots and quantification of LPS-induced p-ERK (F), p-p38 (G) and p-JNK (H) in BMDMs with DMSO or BCI treatment (n=3 per group). One-way ANOVA followed by Dunnett's multiple comparison test; mean±s.e.m.; *P<0.05, **P<0.01, ***P<0.001; ns, not significant.

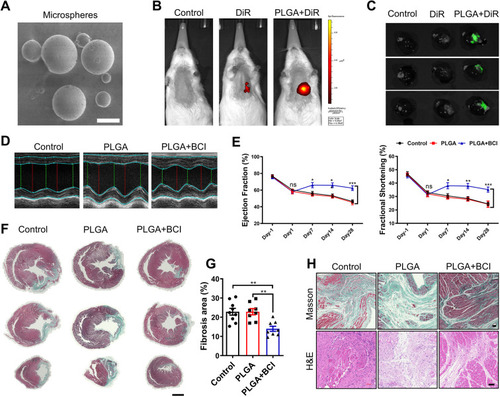
Intramyocardial injection of PLGA-encapsulated BCI improves cardiac function post-MI in rats. (A) Poly (D, L-lactic-co-glycolic acid) (PLGA) microspheres under scanning electron microscopy (scale bar: 5 μm). (B) In vivo fluorescence imaging of rats 4 weeks after intramyocardial injection of normal saline (control), 1,1'-dioctadecyl-3,3,3′,3'-tetramethylindotricarbocyanine iodide (DiR) or PLGA-encapsulated DiR (n=3 per group). (C) Imaging of hearts 4 weeks after intramyocardial injection of normal saline (control), DiR or PLGA-encapsulated DiR (n=3 per group). (D) Representative M-mode tracings from ECHO of control, PLGA-treated and PLGA+BCI treated rat hearts at 4 weeks after MI. (E) Statistical analysis of ejection fraction and fractional shortening of control, PLGA-treated and BCI+PLGA-treated rat hearts 1 day before MI, and on days 1, 7, 14 and 28 after MI (n=8–9). (F) Masson's trichrome staining of control, PLGA-treated and BCI+PLGA-treated hearts at 28 days post-MI. Scale bar: 3 mm. (G) Quantification of Masson's trichrome-stained fibrotic area in F (n=8–9). (H) Masson's trichrome staining and H&E staining of control, PLGA-treated and BCI+PLGA-treated hearts at 28 days post-MI. Scale bars: 300 μm. One-way ANOVA followed by Dunnett's multiple comparison test; mean±s.e.m.; *P<0.05; **P<0.01, ***P<0.001; ns, not significant.

Acknowledgments
This image is the copyrighted work of the attributed author or publisher, and ZFIN has permission only to display this image to its users. Additional permissions should be obtained from the applicable author or publisher of the image. Full text @ Dis. Model. Mech.