
- Title
-
Exposure to Morphine and Cocaine Modify the Transcriptomic Landscape in Zebrafish Embryos
- Authors
- Calderon-Garcia, A.A., Perez-Fernandez, M., Curto-Aguilera, D., Rodriguez-Martin, I., Sánchez-Barba, M., Gonzalez-Nunez, V.
- Source
- Full text @ Neuroscience
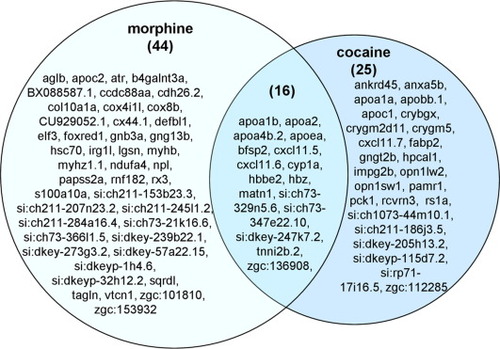
Fig. 1. Venn diagram of deregulated transcripts in zebrafish embryos exposed to 10 μM morphine or 15 μM cocaine. |

Fig. 2. GO enrichment analysis and functional characterization of differentially regulated genes. Analysis of overrepresented GO Terms for (A) morphine and (B) cocaine exposure. GO Terms have been classified based on the three categories (Biological Process, Function, or Location Component), and the Log2 Fold enrichment value is represented on the x-axis. |
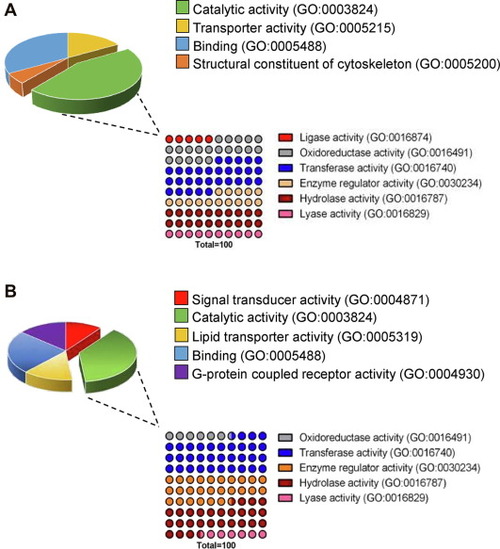
Fig. 3. Schematic representation of overrepresented GO Terms for the category Molecular Function in the transcriptomic analysis of zebrafish embryos exposed to (A) morphine and (B) cocaine. The 10x10 dot plots represent the lower level category GO Terms distribution in the catalytic activity category. |

Fig. 4. Network analysis of deregulated genes identified in the transcriptomic analysis for (A) morphine and (B) cocaine. APID software was used to determine the functional interactions, and visualization of the results was performed with RJSplot software. The color and the size of the nodes represent the changes in the gene expression level between the control and treated groups. |
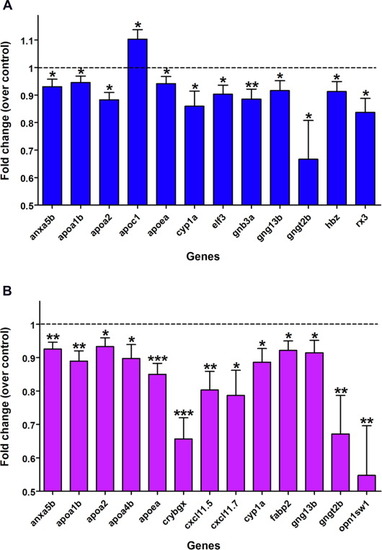
Fig. 5. Qpcr results of selected genes from the rnaseq assay. expression levels were compared between control embryos of 72hpf and exposed to (A) 10 μM morphine or (B) 15 μM cocaine. Data represent the mean ± SEM of at least seven independent assays performed in triplicate. Results have been analyzed with one-way ANOVA (control, morphine, and cocaine treatment), followed by a Tukey post-test. Legend: *p-value < 0.05; **p-value < 0.01; ***p-value < 0.001. |
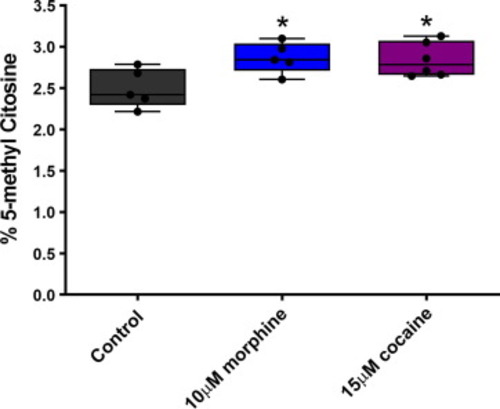
Fig. 6. Global methylation levels (expressed as % of 5-methyl cytosine) in zebrafish embryos of 72hpf, control and treated with 10 μM morphine and 15 μM cocaine. Data correspond to the mean ± SEM of 5 independent experiments performed in duplicate. Results have been analyzed with one-way ANOVA, followed by Tukey post-test. Legend: *p-value < 0.05. |