
- Title
-
Visual object detection biases escape trajectories following acoustic startle in larval zebrafish
- Authors
- Zwaka, H., McGinnis, O.J., Pflitsch, P., Prabha, S., Mansinghka, V., Engert, F., Bolton, A.D.
- Source
- Full text @ Curr. Biol.

Figure 1. Zebrafish switch from randomly directed to biased escapes upon visual detection of barriers (A) Left: overview of experimental setup. Right: typical large-angle short-latency escape turn after tap delivery. (B) Escape trajectories after tap induction, color coded to reflect time, are shown for 3 conditions (no barriers in visible light, barrier in visible light, barrier in the dark). Trajectories begin 20 ms after tap command and trajectories with barrier approaches to the right are reflected across the y axis. 2D histograms depict probability of the escape trajectory passing through a spatial bin for each condition. White asterisk indicates starting position of the fish. Barriers are 12 mm wide and 6 mm high, and fish are tapped when they pass within 2 mm of the barrier (N = 98, n = 967; N = 22, n = 128; N = 21, n = 102). (C) Distribution of preference index for left versus right escapes in no barrier conditions (N = 98). (D) Pairwise comparison of barrier avoidance index (p = 4.77e−5) and collision rate (p = 2.3e−4) in fish tested in both the light and dark (same fish as B middle and right panels). Error bars mark 95% CI of the median. (E) Avoidance index per fish per window of approach angle to the barrier in the light (yellow) and in the dark (light gray). In the light, escapes are not biased in the frontal 25° of visual space but are biased (95% CI above 0) for all other windows. Solid lines represent mean and shaded areas 95% CI. Scale bars in trajectory plots = 2.5 mm; scale bars in 2D histograms = 1.25 mm. Area in dotted box in left (B) panel reflects area plotted in 2D histograms. See Figure S1 for latency and turn amplitude statistics and Figure S2, which shows that naturally biased fish in control barrier-free conditions invert their preference when a barrier is on the side of their bias. See also Figures S1 and S2. |
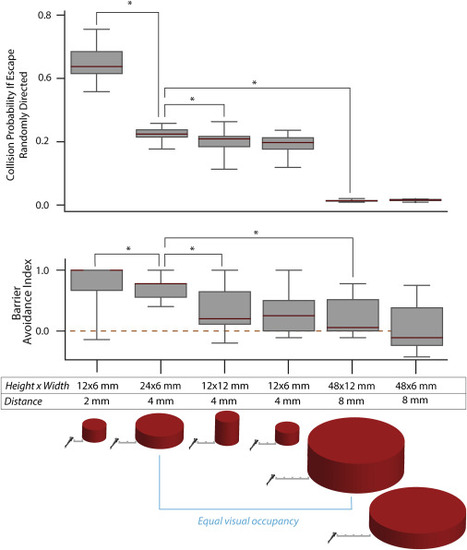
Figure 2. Barrier avoidance depends on barrier size and distance Collision probability is calculated as follows: for each trial within a barrier condition, the heading angle of the fish and the angle to the barrier immediately preceding escape are stored. Each of the 967 trajectories in Figure 1B (no barrier), which reflect the escape behavior of unbiased fish, are then simulated from the stored starting conditions. Intersections between simulated control trajectories and barriers are recorded and divided by the total # of control trajectories to obtain a collision probability per trial. Collision probability therefore reflects how often an unbiased fish would collide with the barriers that subjects encountered during the different barrier conditions. Barrier avoidance decreases in concert with collision probability. The avoidance is also significantly different for barriers with the same retinal occupancy but different distance (blue line) (N = 22, 17, 16, 13, 12, 7; n = 128, 150, 148, 122, 104, 56). Scale bar ticks in diagram, 2 mm. See Figure S3 for a comparison of angle of approach in the shared visual occupancy conditions that suggests a very similar visual input. Mann-Whitney U results: collisions, conditions 1 and 2, p = 2.5e−7; conditions 2 and 3, p = 0.014; conditions 2–5, p = 8.7e−6; BAI, conditions 1 and 2, p = 0.047; conditions 2 and 3, p = 0.009; conditions 2–5, p = 8.1e−4. In boxplots, medians are indicated in red and boxes indicate the interquartile range. See also Figure S3. |
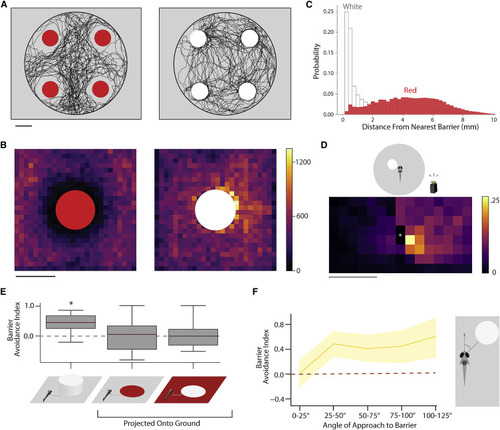
Figure 3. Red barriers are aversive and white barriers attractive, but both are avoided during escape (A) Example trajectories of a zebrafish freely swimming in the arena with four red barriers (left) or four white barriers (right; N = 6, 6). (B) Total visits to each spatial bin surrounding red and white barriers. (C) Distribution of distances from the nearest barrier edge for fish routinely swimming among white and red barriers. Bin size is normalized to the area occupied by each distance. These are the same data that were used to generate the 2D histograms in (B) except a vector is calculated from each coordinate the fish occupies to the nearest barrier edge. Fish coordinates (pooled) are significantly closer to white barriers versus red barriers during routine swimming (p < 2.2e−308, Mann-Whitney U on coordinate magnitudes). The most common distance fish occupy in white conditions is 0.25 mm from barriers, whereas red is 6.34 mm (modes). (D) 2D histogram depicting probability of the escape trajectory passing through a spatial bin for white barrier conditions. White asterisk indicates starting position of the fish (N = 19, n = 254). (E) Average barrier avoidance index for white physical barriers (p = 2.67e−5) and barriers projected onto the floor (N = 19, 20, 20; n = 254, 160, 146). Medians are indicated in red and boxes indicate the interquartile range. (F) Barrier avoidance index for different angles of approach to the white barrier in the light (yellow). As with red barriers, escapes are not biased in the frontal 25° of visual space. Solid lines represent mean and shaded areas 95% CI via bootstrap. Scale bars, 12 mm (A and B) and 1.25 mm (D). |
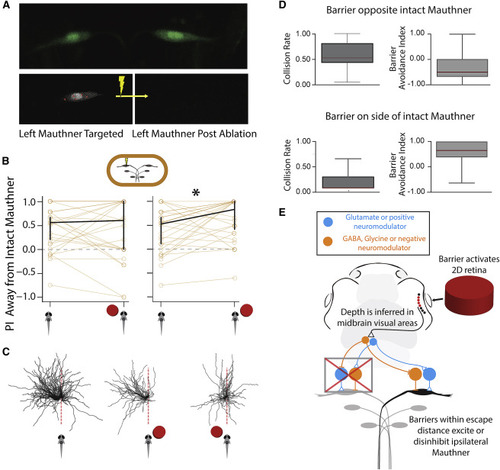
Figure 4. Input into ipsilateral Mauthner cell biases escapes (A) Two-photon image of both Mauthner cells (upper panel) in our custom Gal4 line. Left: Mauthner cell pre-ablation showing our laser targeting protocol for Mauthner destruction. Same cell post ablation. (B) PI for escapes away from intact Mauthner in control and barrier conditions (p = 0.01988) (N = 26, n = 275 control, 192 barrier). Error bars are 95% CI of the median. (C) Individual escape directions for animals with the left Mauthner cell ablated. Fish with an ablated left Mauthner cell show escape bias to the left (left). Escapes in left Mauthner ablated fish with barrier on the right show an increased bias to the left away from the barrier (center), whereas a barrier on the left leads to continued biased escape to the left (toward the barrier). This result suggests that there is no inhibitory mechanism on the intact Mauthner that prevents escapes toward barriers (compare E). (D) Barrier avoidance index and collision rates for fish with Mauthner cell ablations. Fish no longer avoid barriers if the Mauthner cell on the side of the barrier is ablated; ablations reveal that there is no inhibitory mechanism onto the intact Mauthner that prevents collisions with barriers (i.e., the intact Mauthner continues to pull the fish toward barriers. p = 1.6e−5 and 2.8e−5. Medians are indicated in red and boxes indicate the interquartile range. (E) Proposed model after integration of Mauthner cell ablation experiments reveals excitatory/disinhibitory input into ipsilateral Mauthner cell, which favors escapes away from barriers. See also Figure S4. |

Figure 5. Three candidate mechanisms for distance computation in our assay |