FIGURE SUMMARY
Title

An inducible expression system for the manipulation of autophagic flux in vivo

Authors
Schlotawa, L., Lopez, A., Sanchez-Elexpuru, G., Tyrkalska, S.D., Rubinsztein, D.C., Fleming, A.
Source
Full text @ Autophagy

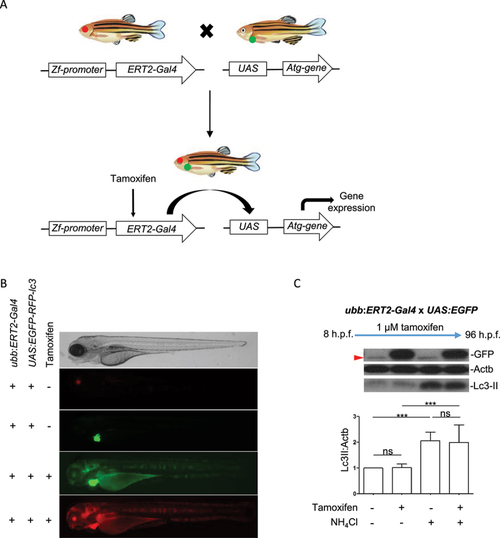
Regulation of transgene expression in ERT2-Gal4 and UAS transgenic lines using tamoxifen. (a) Schematic diagram of crosses from ERT2-Gal4 and UAS transgenic zebrafish. The ERT2:Gal4 transgenes carry a cryaa:RFP cassette therefore transgenic fish can be identified by red fluorescence in the lens. The UAS transgenes carry a myl7:EGFP cassette which drives in GFP expression in the heart. This allows identification of transgenic carriers regardless of UAS expression. From crosses of UAS and Gal4 transgenic fish, 25% of offspring will inherit both transgenes. (b) Tamoxifen induces UAS-driven transgene expression in double transgenic larvae. Offspring of ubb:ERT2-Gal4 and UAS:mRFP-GFP-lc3 were either treated with DMSO or 1 µM tamoxifen. In control (DMSO) conditions, ERT2-Gal4 is inactive as it is retained in the cytoplasm. Therefore, there is no UAS-driven expression in double transgenic zebrafish (red fluorescence in the lens and green fluorescence in the heart demonstrates that the larva carries both transgenes). Upon tamoxifen treatment, ERT2-Gal4 translocates to the nucleus, binds to UAS and activates transgene expression and both green and red fluorescence are seen throughout the body. (c) Tamoxifen treatment does not affect autophagic flux. Lc3-II levels were measured in double transgenic larvae carrying ubb:ERT2-Gal4 and UAS:EGFP transgenes. In control conditions, GFP is not expressed. Treatment with 1 µM tamoxifen induces strong GFP expression but has no effect on Lc3-II levels in either basal or NH4Cl-treated conditions. A nonspecific band (red arrowhead) is present in all lanes and runs just below the level of GFP. This band is obscured by the GFP-positive band in lanes 2 and 4.

Regulation of transgene expression using ERT2-Gal4 and UAS transgenic lines to control autophagic flux. (a) Induction of Atg5 expression results in upregulation of autophagy. All larvae from crosses of ubb:ERT2-Gal4 and UAS:atg5 were treated with 1 µM tamoxifen from 8 h.p.f. to 96 h.p.f. Endogenous Atg5 expression is detected in larvae which do not carry the transgenes. A significant increase in expression of Atg5 is observed in double transgenic larvae (resulting from UAS-transgene expression) and this correlates with increased Lc3-II. NH4Cl treatment is used to block lysosome acidification and therefore block autophagic flux. The increase in Lc3-II observed in Atg5 expressing larvae with NH4Cl treatment reflects the accumulation of autophagosomes which cannot be degraded. (b) Induction of Atg4bC74A expression results in a block in autophagic flux. All larvae from crosses of ubb:ERT2-Gal4 and UAS:FLAG-atg4b_C74A were treated with 1 µM tamoxifen from 8 h.p.f. to 96 h.p.f. Expression of the FLAG-tagged Atg4bC74A transgene is observed in double transgenic larvae and this correlates with an increase Lc3-II. Lc3-II levels do not increase further in NH4Cl treatment conditions indicating that Atg4bC74A expression causes a block in autophagic flux. Nonspecific bands were observed above the FLAG band in all treatment groups and genotypes. (c) Induction of Bcl2l11[EE] expression results in a downregulation of autophagy. All larvae from crosses of ubb:ERT2-Gal4 and UAS:His-bcl2l11[EE] were treated with 1 µM tamoxifen from 8 h.p.f. to 96 h.p.f. Expression of His-tagged Bcl2l11[EE] is observed in double transgenic larvae and this correlates with a decrease in Lc3-II. Lc3-II levels increase in NH4Cl treatment conditions in both non-expressing and Bcl2l11[EE] expressing larvae as autophagosomes cannot be degraded. However, in Bcl2l11[EE] expressing larvae, Lc3-II levels remain significantly lower than non-transgenic siblings indicating a downregulation in autophagy. In all panels, graphs show mean values (± SEM) of densitometry of Lc3-II normalized to Actb (loading control) from >3 independent experiments. All graphs are normalized to the control (no transgene; no NH4Cl treatment) condition. Statistical analysis was performed using paired t-tests; ns – not significant; *p < 0.05; **p < 0.01; ***p < 0.001.

Expression of Atg5 increases autophagic flux in muscle cells. Eggs from a ubb:ERT2-Gal4 x UAS:atg5 cross were injected with the UAS:mRFP-GFP-lc3 reporter and treated with 1 µM tamoxifen from 8 h.p.f. The numbers of autophagosomes and autolysosomes were quantified in individual muscle cells of larvae at 96 h.p.f. (a) Representative images of a muscle cell expressing mRFP-GFP-lc3, a dual-fluorescent reporter for the quantification of autophagic flux. Autophagosomes are visualized as bright puncta evident in both green and red channels (white arrowheads). Red puncta without any green signal correspond to autolysosomes, since the GFP signal has been quenched by the low pH following lysosome fusion. Very few autophagosomes (yellow puncta) are observed compared to autolysosomes (red only puncta) with this reporter construct suggesting autophagosomes rapidly fuse with the lysosome. Images shown are the maximum intensity projections of the green and red channel z-stacks. Scale bar: 20 μm. (b) Representative images of muscle cells expressing mRFP-GFP-lc3 in larvae overexpressing Atg5 and their corresponding non-expressing siblings from a cross of ubb:ERT2-Gal4 x UAS:atg5 fish. Red vesicles (autolysosomes) were more abundant in Atg5-expressing larvae. Few cells were found with yellow vesicles (autophagosomes) in either experimental group. Scale bar: 20 μm. (c) Quantification of autolysosomes per cell area calculated from maximum intensity projection of the red channel of individual muscle cells. Overexpression of Atg5 resulted in a statistically significant increase in autolysosomes. Graph represents the numbers of red puncta normalized to the area of the cell (in pixels) (N = 53 control muscle cells; N = 57 atg5-expressing muscle cells; P < 0.0001).

Temporal control of transgene expression to regulate autophagic flux. (a-c) Larvae from crosses of elavl3:ERT2-Gal4 and UAS:EGFP were used to optimize the timing and concentration of tamoxifen treatment for temporal control of transgene expression. (a) Schematic diagram of different treatment conditions. (b) Treatment of larvae from 8 h.p.f. to 96 h.p.f. with 1 µM tamoxifen (condition ii) resulted in transgene expression which was evident from 24 h.p.f. and strongly expressed in the CNS from 48 h.p.f. onwards. Representative images taken using GFP filter (excitation 395–455 nm; emission 480 nm). (b and c) Treatment with 2 µM tamoxifen was required to induce GFP expression at later time points, from 24 or 48 h.p.f. onwards (conditions iii and iv, respectively). (c) Western blot and quantification of EGFP protein levels (samples run from 3 independent experiments on single gel). (d) Temporal induction of Atg5 expression results in upregulation of autophagy. All larvae from crosses of ubb:ERT2-Gal4 and UAS:atg5 were treated with 0.1 µM tamoxifen from 8 h.p.f. to 72 h.p.f. to prime transgene expression and then with 3 µM tamoxifen from 72 h.p.f. to 96 h.p.f. Atg5 expression was induced, although not as strongly as when treatment was initiated early (quantified in Fig. S1B). Although no increase in Lc3-II was observed in basal conditions, the strong increase in Lc3-II observed in Atg5 expressing larvae with NH4Cl treatment, which is much greater than that observed in non-transgenic siblings with NH4Cl treatment, demonstrates that late induction was able to induce autophagic flux. (e) Temporal induction of Atg4bC74A expression results in a block in autophagic flux. All larvae from crosses of ubb:ERT2-Gal4 and UAS:FLAG-atg4b_C74A were treated with 0.1 µM tamoxifen from 8 h.p.f. to 72 h.p.f. to prime transgene expression and then with 2 µM tamoxifen from 72 h.p.f. to 96 h.p.f. Strong induction of FLAG-tagged Atg4bC74A was observed in double transgenic larvae with this late induction protocol which correlated with an increase Lc3-II expression. Lc3-II levels did not increase in controls versus Atg4bC47A expressing siblings in NH4Cl treatment conditions indicating that Atg4bC74A expression causes a block in autophagic flux. Nonspecific bands (blue arrowheads) were observed in all treatment groups and genotypes. (d and e). Graphs show mean values (± SEM) of densitometry of Lc3-II normalized to Actb (loading control) from at least 3 independent experiments. All graphs are normalized to the control (no treatment) condition. Statistical analysis was performed using paired t-tests: ns – not significant; *p < 0.05; **p < 0.01; ***p < 0.001, ****p < 0.0001.

Autophagy upregulation by induction of Atg5 expression ameliorates pathology in a zebrafish model of tauopathy. (a) Schematic diagram of crosses to generate triple transgenic zebrafish. Photoreceptor degeneration is observed in the zebrafish transgenic line expressing the GFP-tagged human MAPT gene under the control of the rhodopsin promoter (rho:GFP-MAPT/tau transgene). This degeneration has previously been shown to be ameliorated by pharmacological upregulation of autophagy [19]. The rho:GFP-MAPT/tau line was crossed to the UAS:atg5 transgenic line and double transgenic fish were identified as those with GFP expression in the retina and in the heart. These double transgenic fish were crossed with ubb:ERT2-Gal4 transgenic fish. From the final cross, 12.5% of offspring will inherit all 3 transgenes (GFP in retina and heart; RFP in the lens). All offspring were treated with 1 µM tamoxifen from 8 h.p.f. to 9 d.p.f. At the end of the treatment period, larvae were sorted for expression by GFP and RFP expression to identify those expressing only the rho:GFP-MAPT/tau transgene and those expressing all three transgenes. (b) Photoreceptor degeneration analysis. (I) Cryosections through the central retina (plane of section shown by blue line) were imaged and quantified to determine the photoreceptor number and distribution. (ii) Hematoxylin and eosin-stained histological section to demonstrate the photoreceptor layer (arrowheads). L marks position of lens. (c and d) By 9 d.p.f., almost all photoreceptors have degenerated in rho:GFP-MAPT/tau fish (upper panel) with just a few GFP-positive cells (arrowheads) remaining at the ciliary marginal zone. In triple transgenic zebrafish (overexpressing Atg5), there is a significant rescue of photoreceptor degeneration. Representative images taken using GFP filter (excitation 395–455 nm; emission 480 nm). Quantification of photoreceptors is shown in (d), (n ≥ 55 eyes analyzed per group; unpaired t-test, **p < 0.01). Scale bar: 50 µm.

Acknowledgments
This image is the copyrighted work of the attributed author or publisher, and ZFIN has permission only to display this image to its users. Additional permissions should be obtained from the applicable author or publisher of the image. Full text @ Autophagy