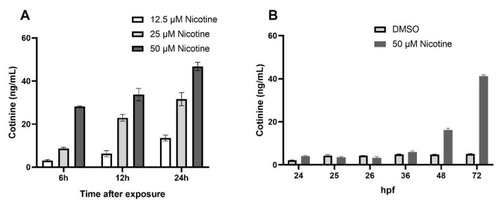
Cotinine levels in zebrafish embryo increases with the time of exposure. (A) Cotinine levels in zebrafish larvae exposed to different nicotine concentrations beginning at 4 dpf. (B) Cotinine levels in embryos exposed to 50 µM nicotine from 6 to 72 hpf.

Embryonic nicotine exposure disrupts craniofacial development. Representative whole mount, neurocranial, and viscerocranial flat mount preparation after nicotine exposure from 6 hpf to 4 dpf. Decreases in the size of the craniofacial skeleton were observed as nicotine concentration increased. All images were captured at 10× magnification. Scale bar 50 µm.

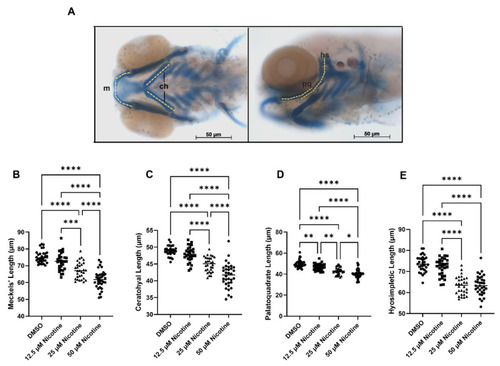
Embryonic nicotine exposure effects viscerocranial cartilages length. (A) Viscerocranial cartilages measurements. (B) Meckel’s length, (C) Ceratohyal length, (D) Palatoquadrate length, and (E) Hyosimpletic length. The size of all viscerocranial cartilages decreased with embryonic exposure to nicotine in a dose-dependent manner. Sample sizes are: DMSO n = 31; 12.5 µM nicotine n = 30; 25 µM nicotine n = 30; and 50 µM nicotine n = 34; m, meckel’s cartilage; ch, ceratohyal; pq, palatoquadrate; hs, hyosimpletic. * = p < 0.05; ** = p < 0.01; *** = p < 0.001; **** = p < 0.0001. All images were captured at 10× magnification. Scale bar 50 µm.

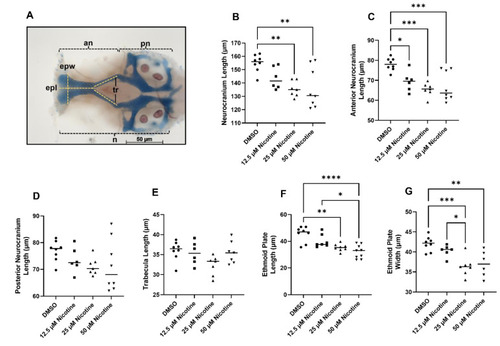
Embryonic nicotine exposure reduces cartilage in the neurocranium. (A) Neurocranium cartilages measurements. (B) Neurocranium total length was reduced following exposure to 25 or 50 µM nicotine. (C) The anterior neurocranium was reduced in all nicotine-exposed groups. (D) Length of the posterior neurocranium and (E) the trabeculae were not affected. Ethmoid plate in length (F) and width (G) was reduced by exposure to 25 µM or 50 µM nicotine. Sample sizes are as follows: DMSO n = 8; 12.5 µM nicotine n = 6; 25 µM nicotine n = 7; and 50 µM nicotine n = 8; epl, plate length; epw, plate width; tr, trabecula; n, neurocranium; an, anterior neurocranium; pn, posterior neurocranium. * = p < 0.05; ** = p < 0.01; *** = p < 0.001; **** = p < 0.0001. All images were captured at 10× magnification. Scale bar 50 µm.

Embryonic nicotine exposure reduces the shoaling response in adult zebrafish. Average distance between the experimental fish and the live shoal, plotted by minute of the 20-min behavioral session. Mean ± SEM is shown. A t-test was used to calculate significance between two groups. (A) Comparison between DMSO (n = 22) and 12.5 µM Nicotine (n = 22) groups (p = 0.2717). (B) Comparison between DMSO and 25 µM Nicotine (n = 30) groups (p = 0.4708). (C) Comparison between DMSO and 50 µM nicotine (n = 23) groups (p = 0.0499).

Embryonic nicotine exposure reduces the time fish spend near a live shoal. (A) Bars represent the time spent in each of the 10 zones during the first 10 min of habituation and (B) the last 10 min of the behavioral session when the stimulus is visible. During habituation, the fish swam back and forth in the tank and spent more time in the zones nearest either end of the tank. During the stimulus, fish from all groups spent more time in zone 1; however, the fish from 50 µM nicotine group spent 23% less time in zone 1 than the control group.

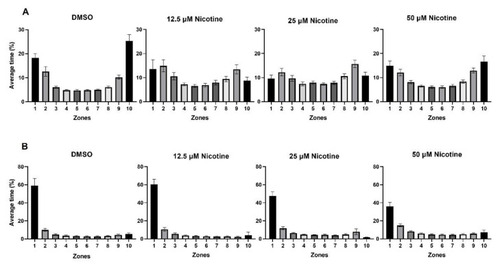
Embryonic exposure to 50 µM nicotine significantly reduces the time spent near a live shoal. Bars represent the average percentage of time spent in the zone closest to the live shoal while the live shoal was visible. * = p < 0.05.

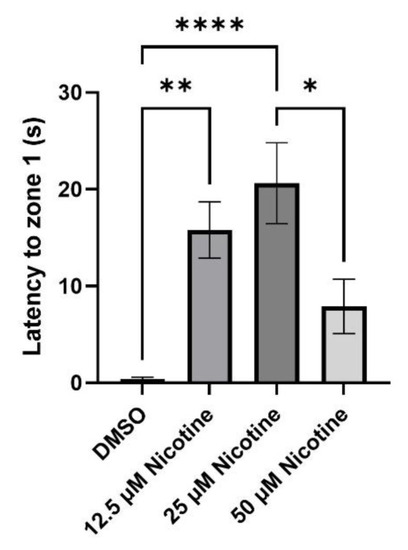
Embryonic nicotine exposure alters the immediate response to a social stimulus in adult zebrafish. Bars represent the time fish take to reach zone 1 once the shoal is visible. While 50 µM nicotine exposure does not change the time to reach 1 one, both the 12.5 µM and 25 µM groups were slower to reach zone 1. * = p < 0.05; ** = p < 0.01; **** = p < 0.0001.

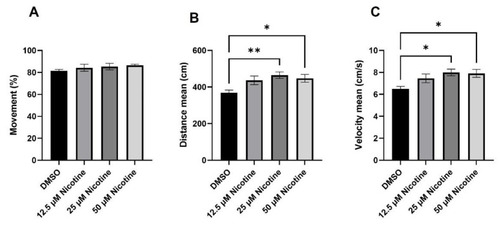
Embryonic nicotine exposure increases locomotion activity in zebrafish adults. Bars represent (A) percentage of time the fish is moving, (B) the total distance traveled, and (C) velocity, during the first 10 min of the behavioral session without stimulus. Embryonic nicotine exposure at 25 µM and 50 µM increases distance traveled and velocity, but does not affect the movement percentage. * = p < 0.05; ** = p < 0.01.

Acknowledgments
This image is the copyrighted work of the attributed author or publisher, and ZFIN has permission only to display this image to its users. Additional permissions should be obtained from the applicable author or publisher of the image. Full text @ Toxics