FIGURE SUMMARY
Title

Automated synapse-level reconstruction of neural circuits in the larval zebrafish brain

Authors
Svara, F., Förster, D., Kubo, F., Januszewski, M., Dal Maschio, M., Schubert, P.J., Kornfeld, J., Wanner, A.A., Laurell, E., Denk, W., Baier, H.
Source
Full text @ Nat. Methods

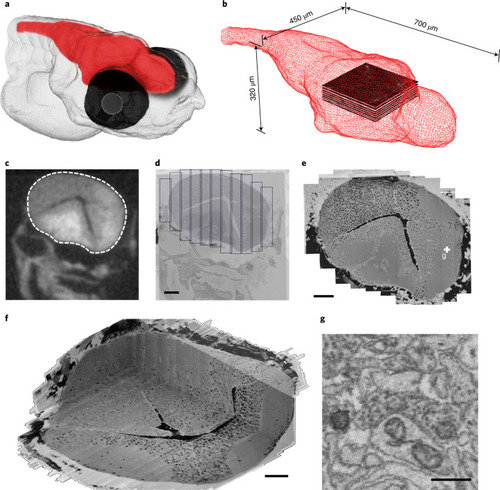
Pretectal 2P calcium imaging and whole-brain larval SBEM dataset acquisition.

a, Illustrative larval zebrafish head at 5 dpf, brain highlighted in red. b, Wire-frame representation of a 5 dpf zebrafish brain, slice stack represents location of the 2P calcium imaged volume centered on the pretectum. c,d, X-ray image (c) of sample used to calculate horizontally stacked tile pattern (d), shown here overlaid on a low-resolution vEM overview image. e, High-resolution vEM imaged brain slice stitched from individual tiles shown in d. f, The resulting high-resolution volume. g, Synaptic contact in pretectum, as highlighted in e. Scale bars, 50 μm (df), 500 nm (g).

Mapping and EM-based reconstruction of functionally characterized pretectal neurons.

a, Single plane of GCaMP5G fluorescence registered to SBEM dataset. bd, Zoomed view of data in a, showing GCaMP5G (b) and scanning EM image (c) individually and as overlay (d). ei, Panels show tracings seeded from soma centers (n = 208) (e), with functional response types classified and named as in ref. 25, neurons skeletonized from those seeds (f), axons (g), dendrites (h) and two individual example neurons (i), for all of the functionally characterized, EM-reconstructed cells, colored by functional response type. Blue and red spheres in i indicate incoming and outgoing synapse locations, respectively. j, All synapse locations with traced (blue) and untraced (black) postsynaptic partners. MoNL, MoNR, MoTL and MoTR refer to monocular nasalward (N) or temporalward (T), left eye (L) or right eye (R). FEL, FER, BEL, BER refers to forward- (F) or backward- (B) selective, excited by left (L) or right (R) eye. FELR refers to forward-selective, excited by left and right eye. FSP and BSP refer to forward (F) or backward (B) specific. Scale bars, 50 μm (a), 5 μm (bd) and 100 μm (ej).

Registration of LM atlas dataset and vEM stack.

a, elavl3:lynTag-RFP (red) and elavl3:H2B-GCaMP6s (false-colored in blue) fluorescence stacks, registered into a common coordinate system. Dorsal view. b, Soma (blue) and neuropil (red) prediction on low-resolution overview vEM data used as registration target, overlaid over raw data. c. Overlay of elavl3:H2B-GCaMP6s (blue) and pou4f3:mGFP (yellow) registered into the vEM brain coordinate system and shown over full resolution vEM data. Scale bars, 100 μm.

Automated neurite segmentation.

a, Dorsal view of the vEM dataset with a multicolored overlay of the base segmentation. b, Close-up examples (one out of at least ten) of the segmentation in, from top left to bottom right, the tectal neuropil (highlighted in a), rostral hypothalamus, intermediate and inferior ventral medulla oblongata. c, Examples of semiautomatically reconstructed neurons. Numbers of corrected merge and split errors are given in parentheses. From left to right: dorsal thalamic projection neuron (mergers, 1; splits, 62), tectal PVIN (1, 124), inferior raphe neuron (14, 52), inferior dorsal medulla oblongata neuron (0, 23) and pretectal interneuron (0, 8). Different colors indicate neuron fragments merged manually. Scale bars, 50 µm (a), 2 µm (b) and 10 µm (c).

Reconstruction of a SIN and its partners.

a, Dorsal view of the selected SIN1. Input (blue) and output (green) synapses are indicated. b, Annotated (upper panel) and raw data (lower panel) for closely neighboring input (blue) and output (green arrowhead) synapses on a SIN’s neurite (red). Arrow in a indicates synapse location. c, Dorsal view of left tectum showing cell body locations of all input (purple) and output (cyan) neurons in the anterior tectum. d, Frontal view showing the SIN (red) and its presynaptic partners (Supplementary Video 1). Arrowheads indicate RGC input synapses onto SIN cell body. Surface of tectal hemisphere is shown in gray. e, Dorsal view of SIN (red) and its input RGC axons in the SFGS layer. Close-ups on the right show that SIN neurites (arrowheads) closely follow the network of RGC axon bundles. f, The SIN (red) and its postsynaptic partners (PVINs not shown for clarity, see Supplementary Video 2 for all postsynaptic cells). The second SIN2 for which we mapped all partners is marked by an arrow. g, Dorsal view showing a network of interconnected SINs. h, Wiring diagram for proofread SINs. Colors match cells shown in g (SINs 7–11 are not visualized for clarity). Synapse numbers are indicated next to arrowheads. Scale bars, 35 µm (a), 1 µm (b) and 85 µm (c). A: anterior, L: lateral, D: dorsal.

Automatic detection of synaptic contacts.

a, Dorsal view of the vEM dataset, vesicle clouds labeled in blue. b, Close-up examples of automatically segmented vesicle clouds (blue) and synaptic clefts (magenta) in thalamus (Th), pretectum (preT), optic tectum (TeO) and ventral hindbrain (vHb). c. Outline of RGC AFs 4 (left) and 7 (right). d, Volume fraction occupied by vesicle clouds, calculated for all AFs as a percentage of total area volume. Visualization adapted from mapzebrain atlas. Scale bars, 50 µm (a), 500 nm (b) and 10 µm (c).

Acknowledgments
This image is the copyrighted work of the attributed author or publisher, and ZFIN has permission only to display this image to its users. Additional permissions should be obtained from the applicable author or publisher of the image. Full text @ Nat. Methods