Immobility is affected by prior fish density and home tank size. Panel (A) shows the cumulative (total) duration of immobility exhibited by zebrafish during the entire 12 min behavioral test period. The size of the housing tank is shown on the X-axis and the fish density is shown by the legend. Bars marked by at least one common letter represent groups that are not different significantly (p > 0.05). Note the tank size dependent fish density effects. Panel (B) shows the duration of immobility exhibited by the experimental zebrafish as a function of 30-s intervals. The upper line-graph shows the performance of fish housed in 1.5 L tanks, the middle line-graph the performance of fish housed in 10 L tanks and the lower line-graph the performance of fish housed in 50 L tanks. The fish density of fish is shown by the legend. The vertical semi-transparent gray bars indicate the period during which still images of zebrafish were shown on the computer screen, and the broken lines with the arrowhead indicate the short period of administering a computer animated expanding dot. Mean + S.E.M. are shown. For detailed statistical results, see Table 1 and the section “Results.”

Speed is affected by prior fish density and home tank size. Panel (A) shows the average speed exhibited by zebrafish during the entire 12 min behavioral test period. The size of the housing tank is shown on the X-axis and the fish density is shown by the legend. Bars marked by at least one common letter represent groups that are not different significantly (p > 0.05). Note that although individual differences were not found among groups, ANOVA revealed a significant fish density x tank size interaction. Panel (B) shows the speed of experimental zebrafish as a function of 30-s intervals. The upper line-graph shows the performance of fish housed in 1.5 L tanks, the middle line-graph the performance of fish housed in 10 L tanks and the lower line-graph the performance of fish housed in 50 L tanks. The fish density of fish is shown by the legend. The vertical semi-transparent gray bars indicate the period during which still images of zebrafish were shown on the computer screen, and the broken lines with the arrowhead indicate the short period of administering a computer animated expanding dot. Mean + S.E.M. are shown. For detailed statistical results, see Table 1 and the section “Results.”

Intra-individual variance of speed is affected by prior fish density and home tank size. Panel (A) shows the average variance of speed exhibited by zebrafish during the entire 12 min behavioral test period. The size of the housing tank is shown on the X-axis and the fish density is shown by the legend. Bars marked by at least one common letter represent groups that are not different significantly (p > 0.05). Panel (B) shows the variance of speed of experimental zebrafish as a function of 30-s intervals. The upper line-graph shows the performance of fish housed in 1.5 L tanks, the middle line-graph the performance of fish housed in 10 L tanks and the lower line-graph the performance of fish housed in 50 L tanks. The fish density of fish is shown by the legend. The vertical semi-transparent gray bars indicate the period during which still images of zebrafish were shown on the computer screen, and the broken lines with the arrowhead indicate the short period of administering a computer animated expanding dot. Mean + S.E.M. are shown. For detailed statistical results, see Table 1 and the section “Results.”

Absolute turn angle is affected by prior fish density and home tank size. Panel (A) shows average turn angle exhibited by zebrafish during the entire 12 min behavioral test period. The size of the housing tank is shown on the X-axis and the fish density is shown by the legend. Bars marked by at least one common letter represent groups that are not different significantly (p > 0.05). Panel (B) shows turn angle of experimental zebrafish as a function of 30-s intervals. The upper line-graph shows the performance of fish housed in 1.5 L tanks, the middle line-graph the performance of fish housed in 10 L tanks and the lower line-graph the performance of fish housed in 50 L tanks. The fish density of fish is shown by the legend. The vertical semi-transparent gray bars indicate the period during which still images of zebrafish were shown on the computer screen, and the broken lines with the arrowhead indicate the short period of administering a computer animated expanding dot. Mean + S.E.M. are shown. For detailed statistical results, see Table 1 and the section “Results.”

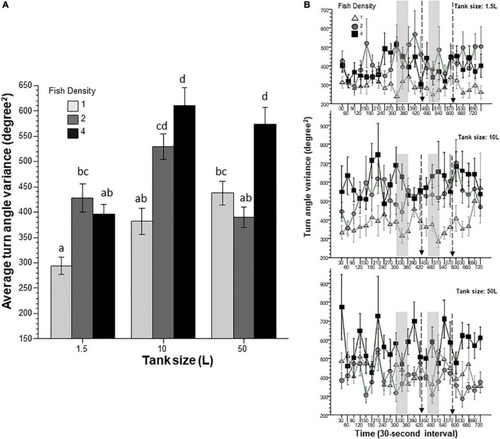
Intra-individual variance of absolute turn angle is affected by prior fish density and home tank size. Panel (A) shows average turn angle variance exhibited by zebrafish during the entire 12 min behavioral test period. The size of the housing tank is shown on the X-axis and the fish density is shown by the legend. Bars marked by at least one common letter represent groups that are not different significantly (p > 0.05). Panel (B) shows turn angle variance of experimental zebrafish as a function of 30-s intervals. The upper line-graph shows the performance of fish housed in 1.5 L tanks, the middle line-graph the performance of fish housed in 10 L tanks and the lower line-graph the performance of fish housed in 50 L tanks. The fish density of fish is shown by the legend. The vertical semi-transparent gray bars indicate the period during which still images of zebrafish were shown on the computer screen, and the broken lines with the arrowhead indicate the short period of administering a computer animated expanding dot. Mean + S.E.M. are shown. For detailed statistical results, see Table 1 and the section “Results.”

Duration of high mobility is affected by prior fish density and home tank size. Panel (A) shows cumulative duration of high mobility exhibited by zebrafish during the entire 12 min behavioral test period. The size of the housing tank is shown on the X-axis and the fish density is shown by the legend. Bars marked by at least one common letter represent groups that are not different significantly (p > 0.05). Panel (B) shows duration of high mobility of experimental zebrafish as a function of 30-s intervals. The upper line-graph shows the performance of fish housed in 1.5 L tanks, the middle line-graph the performance of fish housed in 10 L tanks and the lower line-graph the performance of fish housed in 50 L tanks. The fish density of fish is shown by the legend. The vertical semi-transparent gray bars indicate the period during which still images of zebrafish were shown on the computer screen, and the broken lines with the arrowhead indicate the short period of administering a computer animated expanding dot. Mean + S.E.M. are shown. For detailed statistical results, see Table 1 and the section “Results.”

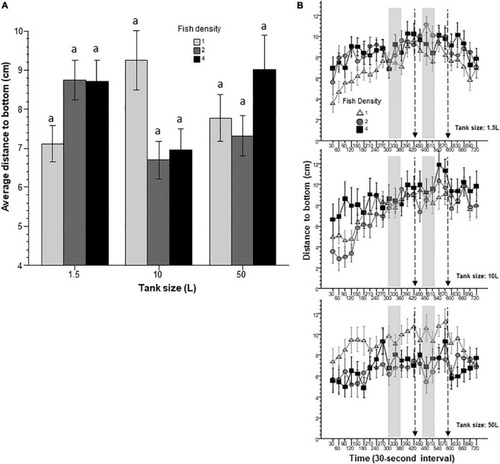
Distance to bottom is affected by prior housing conditions. Panel (A) shows the average distance the fish were from the bottom during the entire 12 min behavioral test period. The size of the housing tank is shown on the X-axis and the fish density is shown by the legend. Bars marked by at least one common letter represent groups that are not different significantly (p > 0.05). Note the lack of significant differences among any groups found by Tukey’s HSD test despite the significant fish density × housing tank size interaction revealed by ANOVA. Panel (B) shows the distance zebrafish were from the bottom as a function of 30-s intervals. The upper line-graph shows the performance of fish housed in 1.5 L tanks, the middle line-graph the performance of fish housed in 10 L tanks and the lower line-graph the performance of fish housed in 50 L tanks. The fish density of fish is shown by the legend. The vertical semi-transparent gray bars indicate the period during which still images of zebrafish were shown on the computer screen, and the broken lines with the arrowhead indicate the short period of administering a computer animated expanding dot. Mean + S.E.M. are shown. For detailed statistical results, see Table 1 and the section “Results.”

Intra-individual temporal variance of distance to bottom appears to be affected by prior housing conditions. Panel (A) shows the average variance of distance the fish were from the bottom during the entire 12 min behavioral test period. The size of the housing tank is shown on the X-axis and the fish density is shown by the legend. Bars marked by at least one common letter represent groups that are not different significantly (p > 0.05). Note the lack of significant differences among any groups found by Tukey’s HSD and that tank size effect and the tank size × fish density interaction was found by ANOVA to border, but did not reach, the level of significance. Panel (B) shows the variance of distance zebrafish were from the bottom as a function of 30-s intervals. The upper line-graph shows the performance of fish housed in 1.5 L tanks, the middle line-graph the performance of fish housed in 10 L tanks and the lower line-graph the performance of fish housed in 50 L tanks. The fish density of fish is shown by the legend. The vertical semi-transparent gray bars indicate the period during which still images of zebrafish were shown on the computer screen, and the broken lines with the arrowhead indicate the short period of administering a computer animated expanding dot. Mean + S.E.M. are shown. For detailed statistical results, see Table 1 and the section “Results.”

Distance to stimulus screen is affected by prior fish density. Panel (A) shows the average distance the fish were from the stimulus screen during the entire 12 min behavioral test period. The size of the housing tank is shown on the X-axis and the fish density is shown by the legend. Bars marked by at least one common letter represent groups that are not different significantly (p > 0.05). Note the lack of significant differences among any groups found by Tukey’s HSD test despite the significant fish density effect revealed by ANOVA. Panel (B) shows the distance zebrafish were from the stimulus screen as a function of 30-s intervals. The upper line-graph shows the performance of fish housed in 1.5 L tanks, the middle line-graph the performance of fish housed in 10 L tanks and the lower line-graph the performance of fish housed in 50 L tanks. The fish density of fish is shown by the legend. The vertical semi-transparent gray bars indicate the period during which still images of zebrafish were shown on the computer screen, and the broken lines with the arrowhead indicate the short periods of administering a computer animated expanding dot. Mean + S.E.M. are shown. For detailed statistical results, see Table 1 and the section “Results.”

Acknowledgments
This image is the copyrighted work of the attributed author or publisher, and ZFIN has permission only to display this image to its users. Additional permissions should be obtained from the applicable author or publisher of the image. Full text @ Front. Behav. Neurosci.