
- Title
-
Zebrafish Model of Stickler Syndrome Suggests a Role for Col2a1a in the Neural Crest during Early Eye Development
- Authors
- Williams, A.L., Bohnsack, B.L.
- Source
- Full text @ J Dev Biol
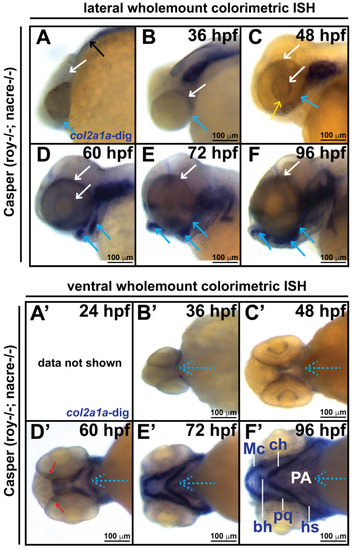
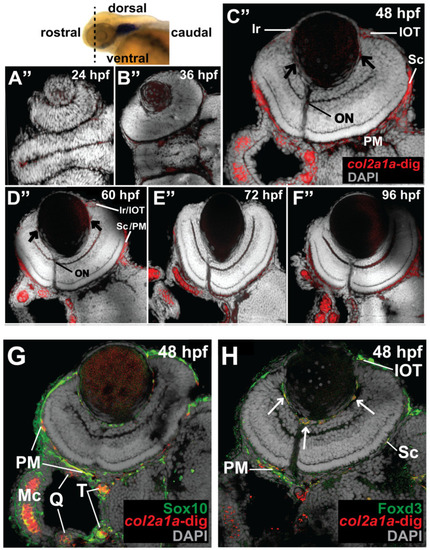
Col2a1a is expressed in the ocular neural crest during early development. Wholemount in situ hybridization in WT Casper (roy−/−; nacre−/−) zebrafish embryos during development at 24, 36, 48, 60, 72 and 96 hpf. Col2a1a gene expression was detected using a colorimetric assay (Vector Blue Substrate Kit, Vector Laboratories) that is both chromogenic (blue) and fluorescent (Far Red/Cy5). The sections were mounted in a media containing DAPI (gray). Lateral (A–F) brightfield wholemount images show that col2a1a expression initiates within the hindbrain (black arrow, (A) notochord at 24 hpf with dorsoposterior (white arrows, (B–F)) and ventral (blue arrows, (B–F)) progression into the ocular and craniofacial expression during eye and jaw development. The yellow arrow (C) highlights col2a1a expression in the ocular fissure at 48 hpf. Ventral (B’–F’) brightfield wholemount images show col2a1a expression in the developing jaw. The ventral-anterior progression of col2a1a expression is indicated (blue dashed arrows). The red arrows (D’) highlight col2a1a expression in the optic nerve at 60 hpf. By 96 hpf (F’), profound col2a1a expression was detected in the developing jaw and pharyngeal arches (PA). A ventral image of embryonic col2a1a expression at 24 hpf (A’) was not obtained because the embryo is tightly bound to the yolk mass at this stage of development, making it difficult to image the ventral side. Mc, Meckel’s cartilage; pq, palatoquadrate; ch, ceratohyal; bh, basihyal; hs, hyosympletic. Transverse cephalic sections and fluorescence (FL) microscopy analyses (A”–F”) provide additional information for significant ocular col2a1a expression in the anterior segment, with apparent expression in the anterior segment [iris (Ir), iris outflow tract (IOT), hyaloid vasculature (black arrows), sclera (Sc), periocular mesenchyme (PM), and optic nerve (ON)] at 48 hpf (C”). The dashed line in the lateral wholemount brightfield image of a 48 hpf embryo indicates the orientation of the plane of section, which passes perpendicular to the spinal column and extends in the rostral-caudal direction. (G,H) Wholemount colorimetric in situ hybridization, followed by GFP immunostaining in Tg(sox10::EGFP) and Tg(foxd3::EGFP) zebrafish embryos during early development at 48 hpf revealed the colocalization of col2a1a expression with neural crest cell markers in the developing jaw (G) [Meckel’s cartilage (Mc), trabeculae (T), and quadrate (Q)] and anterior segment (H) (hyaloid vasculature (white arrows), iris outflow tract (IOT), sclera (Sc), and periocular mesenchyme (PM)). |
Col2a1a is expressed in the ocular neural crest during early development. Wholemount in situ hybridization in WT Casper (roy−/−; nacre−/−) zebrafish embryos during development at 24, 36, 48, 60, 72 and 96 hpf. Col2a1a gene expression was detected using a colorimetric assay (Vector Blue Substrate Kit, Vector Laboratories) that is both chromogenic (blue) and fluorescent (Far Red/Cy5). The sections were mounted in a media containing DAPI (gray). Lateral (A–F) brightfield wholemount images show that col2a1a expression initiates within the hindbrain (black arrow, (A) notochord at 24 hpf with dorsoposterior (white arrows, (B–F)) and ventral (blue arrows, (B–F)) progression into the ocular and craniofacial expression during eye and jaw development. The yellow arrow (C) highlights col2a1a expression in the ocular fissure at 48 hpf. Ventral (B’–F’) brightfield wholemount images show col2a1a expression in the developing jaw. The ventral-anterior progression of col2a1a expression is indicated (blue dashed arrows). The red arrows (D’) highlight col2a1a expression in the optic nerve at 60 hpf. By 96 hpf (F’), profound col2a1a expression was detected in the developing jaw and pharyngeal arches (PA). A ventral image of embryonic col2a1a expression at 24 hpf (A’) was not obtained because the embryo is tightly bound to the yolk mass at this stage of development, making it difficult to image the ventral side. Mc, Meckel’s cartilage; pq, palatoquadrate; ch, ceratohyal; bh, basihyal; hs, hyosympletic. Transverse cephalic sections and fluorescence (FL) microscopy analyses (A”–F”) provide additional information for significant ocular col2a1a expression in the anterior segment, with apparent expression in the anterior segment [iris (Ir), iris outflow tract (IOT), hyaloid vasculature (black arrows), sclera (Sc), periocular mesenchyme (PM), and optic nerve (ON)] at 48 hpf (C”). The dashed line in the lateral wholemount brightfield image of a 48 hpf embryo indicates the orientation of the plane of section, which passes perpendicular to the spinal column and extends in the rostral-caudal direction. (G,H) Wholemount colorimetric in situ hybridization, followed by GFP immunostaining in Tg(sox10::EGFP) and Tg(foxd3::EGFP) zebrafish embryos during early development at 48 hpf revealed the colocalization of col2a1a expression with neural crest cell markers in the developing jaw (G) [Meckel’s cartilage (Mc), trabeculae (T), and quadrate (Q)] and anterior segment (H) (hyaloid vasculature (white arrows), iris outflow tract (IOT), sclera (Sc), and periocular mesenchyme (PM)). |
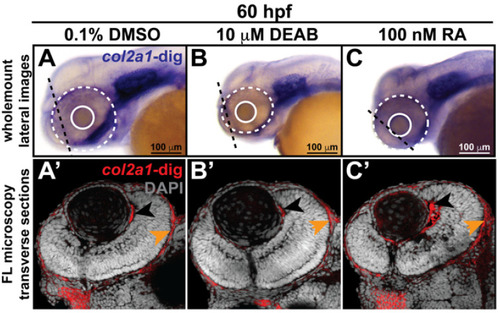
Retinoic acid regulates col2a1a expression in the ocular neural crest. Treatment with 10 mM DEAB, a selective pan-aldehyde dehydrogenase inhibitor, and 100 nM RA effectively decreased and increased, respectively, ocular col2a1a expression in WT Casper zebrafish embryos compared with their DMSO control-treated counterparts. Wholemount in situ analysis was performed using a chromogenic (blue) colorimetric assay (Vector Blue Substrate Kit, Vector Laboratories). Lateral images (A–C) at 60 hpf show the teratogenic effects of pharmacological insult on the ocular development of the treated embryos. The solid and dashed circles highlight the effect on eye size. The black dashed lines indicate the orientation of the plane of section, which passes perpendicular to the spinal column and extends in the rostral-caudal direction. FL microscopy analysis of transverse cephalic sections of the treated embryos at 60 hpf obtained after wholemount colorimetric in situ analysis developed using a fluorescent (Far Red/Cy5) substrate (Vector Blue Substrate Kit, Vector Laboratories) (A’–C’) show the effects of pharmacological insult on the anterior segment within the developing eye. The black arrowhead highlights col2a1a expression in the hyaloid vasculature and the orange arrowhead highlights col2a1a expression in the sclera/periocular mesenchyme. Quantification of these effects (D) shows that DEAB significantly decreased col2a1a expression, while RA significantly increased col2a1a expression. *, p-value ≤ 0.05. Ventral images (E,F,G) of wholemount in situ analysis at 90 hpf show the teratogenic effects of pharmacological insult on the ocular and craniofacial development of treated embryos. The solid and dashed circles highlight the effect on eye size. The white (Meckel’s cartilage development) and red (basihyal development) arrows highlight the effects on jaw development. The asterisks highlight the areas of pharyngeal arch development. |

Retinoic acid regulates col2a1a expression in the ocular neural crest. Treatment with 10 mM DEAB, a selective pan-aldehyde dehydrogenase inhibitor, and 100 nM RA effectively decreased and increased, respectively, ocular col2a1a expression in WT Casper zebrafish embryos compared with their DMSO control-treated counterparts. Wholemount in situ analysis was performed using a chromogenic (blue) colorimetric assay (Vector Blue Substrate Kit, Vector Laboratories). Lateral images (A–C) at 60 hpf show the teratogenic effects of pharmacological insult on the ocular development of the treated embryos. The solid and dashed circles highlight the effect on eye size. The black dashed lines indicate the orientation of the plane of section, which passes perpendicular to the spinal column and extends in the rostral-caudal direction. FL microscopy analysis of transverse cephalic sections of the treated embryos at 60 hpf obtained after wholemount colorimetric in situ analysis developed using a fluorescent (Far Red/Cy5) substrate (Vector Blue Substrate Kit, Vector Laboratories) (A’–C’) show the effects of pharmacological insult on the anterior segment within the developing eye. The black arrowhead highlights col2a1a expression in the hyaloid vasculature and the orange arrowhead highlights col2a1a expression in the sclera/periocular mesenchyme. Quantification of these effects (D) shows that DEAB significantly decreased col2a1a expression, while RA significantly increased col2a1a expression. *, p-value ≤ 0.05. Ventral images (E,F,G) of wholemount in situ analysis at 90 hpf show the teratogenic effects of pharmacological insult on the ocular and craniofacial development of treated embryos. The solid and dashed circles highlight the effect on eye size. The white (Meckel’s cartilage development) and red (basihyal development) arrows highlight the effects on jaw development. The asterisks highlight the areas of pharyngeal arch development. |
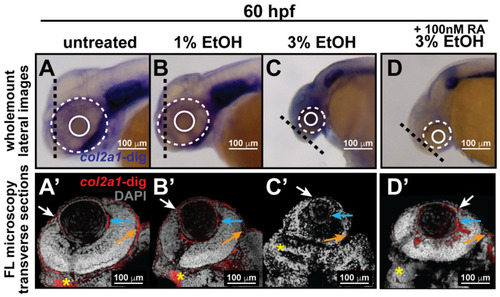
Ethanol decreased col2a1a expression in the ocular neural crest and developing jaw. Treatment with 1% and 3% ethanol from 24 to 48 hpf, followed by wholemount in situ hybridization analysis using a chromogenic (blue) colorimetric assay (Vector Blue Substrate Kit, Vector Laboratories) and FL microscopy analysis of the fluorescent (Far Red/Cy5) colorimetric substrate (Vector Blue Substrate Kit, Vector Laboratories) at 60 and 90 hpf revealed decreased col2a1a expression in the developing eyes and jaws of treated WT Casper zebrafish embryos compared with their untreated and 1% ETOH-treated counterparts. Lateral images (A–C) of wholemount colorimetric in situ analysis at 60 hpf show the teratogenic effects on the ocular development of the treated embryos. The solid and dashed circles highlight the effect on eye size. The black dashed lines indicate the orientation of the plane of section, which passes perpendicular to the spinal column and extends in the rostral-caudal direction. Transverse cephalic sections of the colorimetric in situ analysis (A’–C’) of treated embryos at 60 hpf show a significant decrease in col2a1a expression in the anterior segment [white arrow, iris; blue arrow, hyaloid; orange arrow, sclera, and periocular mesenchyme) of the developing eye with 3% ETOH treatment. The yellow asterisks highlight craniofacial col2a1a expression. Quantification of these effects (E) shows that 3% significantly decreased col2a1a expression. *, p-value ≤ 0.05. Ventral images (F–I) of wholemount colorimetric in situ analysis show significantly delayed jaw development, with severe malformations of the pharyngeal arches (PA) and basihyal (red arrow) and Meckel’s cartilage (white arrow) in treated embryos at 96 hpf. Combined treatment with 3% ETOH from 24–48 hpf and RA from 27–96 hpf increased col2a1a expression in the ocular anterior segment (D’) and partially rescued the teratogenic effects of 3% ethanol treatment on eye development at 60 hpf (D,E) but did not restore col2a1a expression in the craniofacial neural crest (yellow asterisk, (D’)) and further potentiated the deleterious effects of ethanol treatment on the developing jaw (white asterisk, (I)) at 96 hpf. |

Ethanol decreased col2a1a expression in the ocular neural crest and developing jaw. Treatment with 1% and 3% ethanol from 24 to 48 hpf, followed by wholemount in situ hybridization analysis using a chromogenic (blue) colorimetric assay (Vector Blue Substrate Kit, Vector Laboratories) and FL microscopy analysis of the fluorescent (Far Red/Cy5) colorimetric substrate (Vector Blue Substrate Kit, Vector Laboratories) at 60 and 90 hpf revealed decreased col2a1a expression in the developing eyes and jaws of treated WT Casper zebrafish embryos compared with their untreated and 1% ETOH-treated counterparts. Lateral images (A–C) of wholemount colorimetric in situ analysis at 60 hpf show the teratogenic effects on the ocular development of the treated embryos. The solid and dashed circles highlight the effect on eye size. The black dashed lines indicate the orientation of the plane of section, which passes perpendicular to the spinal column and extends in the rostral-caudal direction. Transverse cephalic sections of the colorimetric in situ analysis (A’–C’) of treated embryos at 60 hpf show a significant decrease in col2a1a expression in the anterior segment [white arrow, iris; blue arrow, hyaloid; orange arrow, sclera, and periocular mesenchyme) of the developing eye with 3% ETOH treatment. The yellow asterisks highlight craniofacial col2a1a expression. Quantification of these effects (E) shows that 3% significantly decreased col2a1a expression. *, p-value ≤ 0.05. Ventral images (F–I) of wholemount colorimetric in situ analysis show significantly delayed jaw development, with severe malformations of the pharyngeal arches (PA) and basihyal (red arrow) and Meckel’s cartilage (white arrow) in treated embryos at 96 hpf. Combined treatment with 3% ETOH from 24–48 hpf and RA from 27–96 hpf increased col2a1a expression in the ocular anterior segment (D’) and partially rescued the teratogenic effects of 3% ethanol treatment on eye development at 60 hpf (D,E) but did not restore col2a1a expression in the craniofacial neural crest (yellow asterisk, (D’)) and further potentiated the deleterious effects of ethanol treatment on the developing jaw (white asterisk, (I)) at 96 hpf. |

Col2a1a knockdown mimicked the characteristic features of human Stickler syndrome in zebrafish. A lissamine-tagged antisense MO targeting the promoter region (prMO) of col2a1a was injected into TgBAC(col2a1a::EGFP) and Tg(sox10::EGFP) embryos at the single-cell stage. Lateral FL microscopy images (A) show the loss of GFP reporter expression driven by the col2a1a promoter in TgBAC(col2a1a::EGFP) transgenic fish (lower right panel) compared with uninjected and standard control (std ctrl) MO-injected embryos (upper right and middle panels, respectively). Quantification of this effect showed a significant loss of expression (B). MO-injected Sox10-positive transgenic zebrafish embryos showed skeletal defects, including scoliosis (upper right panel, dashed black line, (C)) and significantly shortened body length (D), measured perpendicular to the spine from the tip of the epiphysis to the area above the urogenital opening (white dashed arrow (inset, D), delayed neural crest-derived jaw development (white arrowhead, upper right panel and black asterisk, lower right-most panel, (C)), and significantly smaller bulging eyes (solid and dashed circles, (C,E)), as measured along the anterior–posterior (a-p; inset, E) and dorsal-ventral (d-v; inset, E) axes, compared with uninjected and std ctrl MO-injected embryos at 48 and 72 hpf (left and middle panels, (C–E)). *, p-value ≤ 0.05; **, p-value ≤ 0.001. EXPRESSION / LABELING:
PHENOTYPE:
|
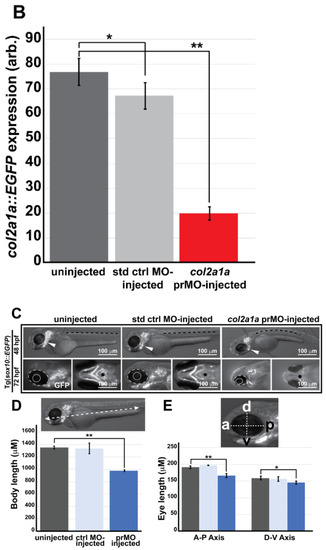
Col2a1a knockdown mimicked the characteristic features of human Stickler syndrome in zebrafish. A lissamine-tagged antisense MO targeting the promoter region (prMO) of col2a1a was injected into TgBAC(col2a1a::EGFP) and Tg(sox10::EGFP) embryos at the single-cell stage. Lateral FL microscopy images (A) show the loss of GFP reporter expression driven by the col2a1a promoter in TgBAC(col2a1a::EGFP) transgenic fish (lower right panel) compared with uninjected and standard control (std ctrl) MO-injected embryos (upper right and middle panels, respectively). Quantification of this effect showed a significant loss of expression (B). MO-injected Sox10-positive transgenic zebrafish embryos showed skeletal defects, including scoliosis (upper right panel, dashed black line, (C)) and significantly shortened body length (D), measured perpendicular to the spine from the tip of the epiphysis to the area above the urogenital opening (white dashed arrow (inset, D), delayed neural crest-derived jaw development (white arrowhead, upper right panel and black asterisk, lower right-most panel, (C)), and significantly smaller bulging eyes (solid and dashed circles, (C,E)), as measured along the anterior–posterior (a-p; inset, E) and dorsal-ventral (d-v; inset, E) axes, compared with uninjected and std ctrl MO-injected embryos at 48 and 72 hpf (left and middle panels, (C–E)). *, p-value ≤ 0.05; **, p-value ≤ 0.001. |
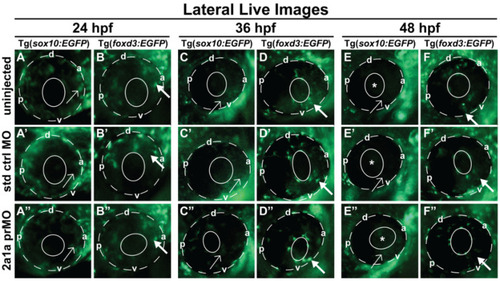
Col2a1a MO knockdown differentially affected Sox10 and Foxd3 expression and ocular neural crest cell migration during early eye development. Lateral live imaging at 24, 36 and 48 hpf showing the effects of Col2a1a knockdown on GFP reporter expression in Tg (foxd3::EGFP) and Tg(sox10::EGFP) transgenic zebrafish embryos injected at the single-cell stage with a lissamine-tagged antisense prMO targeting col2a1a. (A–F) uninjected, (A’–F’) standard control (std ctrl) MO-injected, (A”–F”) col2a1a promoter MO (prMO)-injected. Foxd3-positive cell migration (bold arrows, (F”)) was not affected after MO injection compared with that in std ctrl MO-injected (D”) and uninjected embryos (B”). Sox10-positive cell migration (E”) was markedly disrupted in response to Col2a1a MO knockdown, as these cells were retained in the anterior segment (asterisk) and periocular mesenchyme (single arrows) in contrast to the cells in their uninjected (F) and std ctrl-injected counterparts (F’), which showed few Sox10-positive cells in the anterior segment at 48 hpf. The solid and dashed circles highlight the lens and retinal piment epithelium, respectively, in the zebrafish eyes. d, dorsal; v, ventral; p, posterior; a, anterior. |
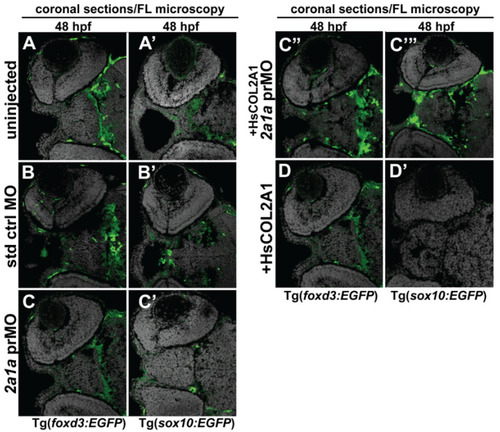
Col2a1a MO knockdown differentially affected ocular neural crest cell Sox10 and Foxd3 expression during early eye development. FL microscopy analysis of the effects of Col2a1a knockdown on GFP reporter expression in transverse cephalic sections from 48 hpf Tg (foxd3::EGFP) and Tg(sox10::EGFP) transgenic zebrafish embryos injected at the single-cell stage with a lissamine-tagged antisense prMO targeting col2a1a. MO knockdown of Col2a1a adversely affected Sox10-positive GFP expression in ocular anterior segment neural crest cells (A’–C’). The Foxd3-positive GFP expression in ocular neural crest cells was not affected by Col2a1a knockdown (A–C,C”,D). The coinjection of human (Hs) COL2A1 protein rescued Sox10-positive GFP expression (C’’’), while the injection of HsCOL2A1 alone (D’) adversely affected ocular Sox10-positive GFP expression in neural crest cells. |