
- Title
-
Adamts10 controls transforming growth factor β family signaling that contributes to retinal ganglion cell development
- Authors
- Wareham, L.K., Whitener, A.E., Wu, H.J., Wu, S.Y., Mchaourab, H.S., Mortlock, D.P., Kuchtey, R.W., Kuchtey, J.
- Source
- Full text @ Front Mol Biosci

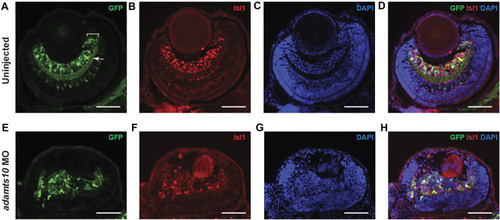
Ocular expression of |

EXPRESSION / LABELING:
PHENOTYPE:
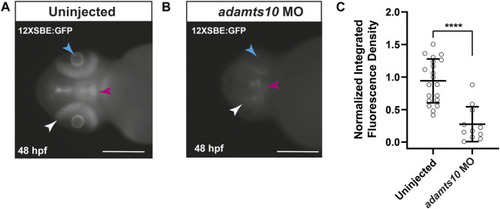
|

|
PHENOTYPE:
|
|
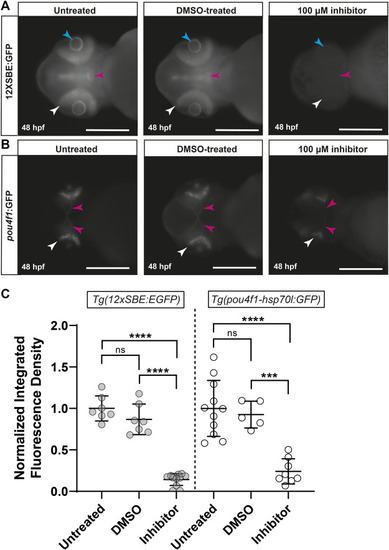
Inhibition of TGFβ signaling with SB431542 reduces |