
- Title
-
A Zebrafish/Drosophila Dual System Model for Investigating Human Microcephaly
- Authors
- Bartoszewski, S., Dawidziuk, M., Kasica, N., Durak, R., Jurek, M., Podwysocka, A., Guilbride, D.L., Podlasz, P., Winata, C.L., Gawlinski, P.
- Source
- Full text @ Cells

Dorsal view comparison of zebrafish larvae at 3 dpf injected with MOs. (a) Standard control oligo was injected as a negative control. (b) Zebrafish larvae injected with tubgcp2 translation-blocking MO. (c) Zebrafish larvae injected with tubgcp2 splice-blocking MO. (d) Zebrafish larvae co-injected with tubgcp2 translation-blocking MO and tubgcp2 wild type mRNA. (e) Zebrafish larvae co-injected with tubgcp2 splice MO and tubgcp2 wild type mRNA. PHENOTYPE:
|

Wild type tubgcp2 mRNA pre-empts microcephaly in tubgcp2-depleted morphants at 3 dpf. (a) Percent of morphant larvae obtained with microcephaly when treated with tubgcp2 translation-inhibiting or splicing-inhibiting MO (see Supplementary Table S1 for experimental numbers and statistics). (b) Microcephaly index = head width/body length ratio = (c)/(d) for tubgcp2-depleted and tubgcp2 mRNA-rescued morphants. (c) Head width; (d) body length. Statistical multiple comparisons completed using one-way ANOVA; * p ≤ 0.05, ** p ≤ 0.01, *** p ≤ 0.001, **** p ≤ 0.0001. This includes Ŝidák’s correction for multiple comparisons. PHENOTYPE:
|
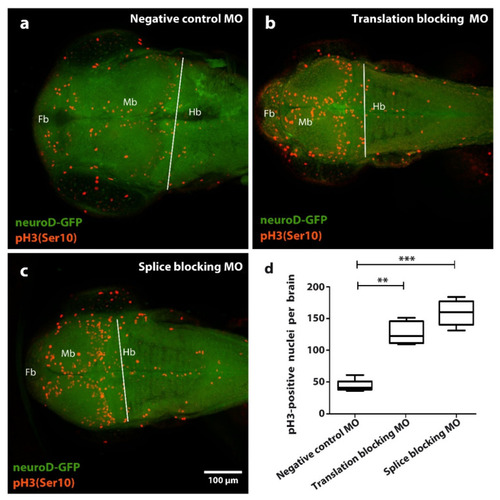
Effect of tubgcp2 knockdown using microinjection of morpholino antisense oligonucleotides (MOs) blocking either splicing or translation, on number of pH3/Ser10) immunoreactive (IR) nuclei in zebrafish brain tissue at 3 dpf. Immunohistochemical staining of Tg(neuroD:GFP) larvae 2 dpf (green): pH3 (Ser 10) (red) shows distribution of pH3 (Ser 10) IR nuclei in (a) control, (b) translation-blocking MO, and (c) splice-blocking MO-treated groups within the forebrain (Fb), midbrain (Mb), and hindbrain (Hb). (d) Quantification of pH3 (Ser 10) IR nuclei in larvae at 2 dpf. Quantifications derive from Fb + Mb areas within limit (white line) lying along midbrain-hindbrain border. Statistical test one-way ANOVA and Kruskal–Wallis analysis was completed using GraphPad Prism 5; ** p ≤ 0.01, *** p ≤ 0.001. Compared to the control group (a), translation-blocking MO injection (b) results in an approximate 3-fold increase of pH3 (Ser 10) IR nuclei, whereas splice-blocking MO injection (c) results in a near 4-fold increase of pH3 (Ser 10) IR nuclei. EXPRESSION / LABELING:
PHENOTYPE:
|

Phenotypes of the Grip84 mutants. (a) Wild type (WT) male sibling and (b) (WT) female sibling, lateral and dorsal views, respectively. (c) Grip84PG36 hypomorphic male fly lacking vast region of the normal cuticle on the abdomen. (d) Pharate adult female fly, Df(1)14.4; Dp(1;3)DC364; pulled out of the pupal case, shown from dorsal view and (e) ventral view. The abdominal pigmented cuticle is completely absent. Yellow arrowheads point at the bases of four bristles on the notum in the WT female fly; (b) in the mutant female fly, (d) only one bristle is left. In the mutant female, one of the legs is incorrectly developed ((e) arrow); in some cases partial leg duplications were observed for the same genotype (f). A wild type eye from panel a is magnified in (g), showing the characteristic, hexagonal structure, which is absent in Df(1)14.4; Dp(1;3)DC364 flies (h). |
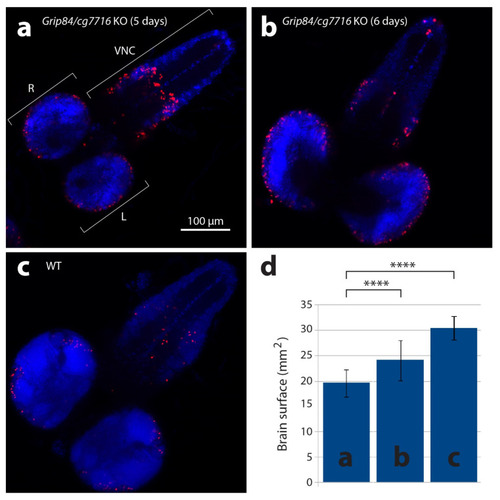
Larval brains stained with anti-phospho-histone H3 antibodies detecting mitotic nuclei (red) and DAPI. (a) Brain from five-day-old mutant larvae Df(1)14.4; Mi{ET1}CG7716MB07394 Dp(1;3)DC364 PBac{y+w+}, amorphic (activity absent) for both Grip84 and cg7716. (b) Mutant six-day-old larvae brain and (c) five-day-old WT sibling larvae brain. Specimens shown in (b,c) are just before pupation. (d) Brain hemisphere surface area (SA) quantification for brains shown in (a–c), with standard deviation. Statistical multiple comparisons completed using one-way ANOVA; **** p ≤ 0.0001. R—right hemisphere, L—left hemisphere, VNC—ventral nerve cord. |
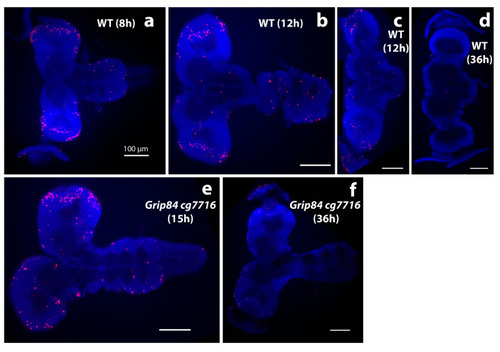
Brain morphology during pupation stained with DAPI stain (blue); anti-phospho-histone H3 (anti-pH3, red). (a–d) Brains from wild type siblings’ pupae; (e,f) Df(1)14.4; Mi{ET1}CG7716MB07394 Dp(1;3)DC364 PBac{y+w+} mutants. (a) Normal pupal brains 8 h after pupal case formation resemble larval brains, although the hemispheres elongate distally and show clear mitotic zones at the tips, marked by anti-pH3. (b) Further elongation is seen at 12 h, when normal brain and ventral nerve cord lose tight connection. (c) The majority of normal brains are dissected separately at this time point. (d) WT brains one day later at 36 h look different; the connection to eyes becomes visible; mitoses are not seen. Early stage mutant brains resemble wild type. (e) Mutant brains at 15 h (after early adult body parts are formed in normal pupae) and (f) at 36 h resemble “early 12 h wild type”. At 36 h, brain mitoses are barely detected. White bar = 100 μm. |