
- Title
-
Zebrafish Danio rerio myotomal muscle structure and growth from a spatial transcriptomics perspective
- Authors
- Liu, G., Ito, T., Kijima, Y., Yoshitake, K., Asakawa, S., Watabe, S., Kinoshita, S.
- Source
- Full text @ Genomics
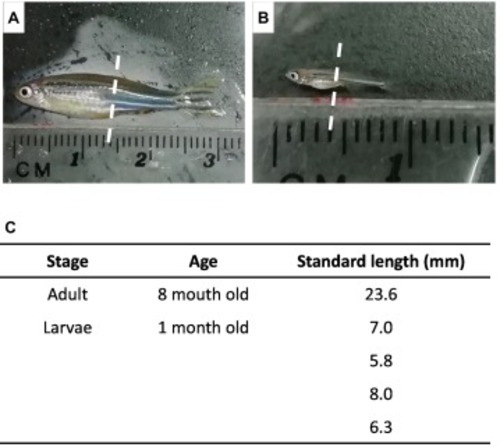
Fig. 1. Adult and larval zebrafish used in this study. A, adult zebrafish. B, larval zebrafish. The dotted line indicates the site of the transverse section. C, the standard length of each specimen. We used four specimens for the larval section. |
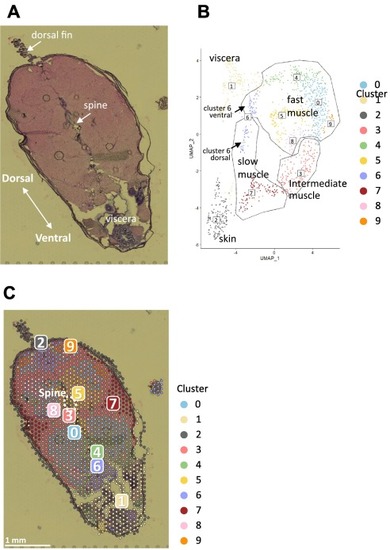
Fig. 2. Clustering and reduction in the dimensionality of spots in the adult zebrafish section. A, microscope image of the adult zebrafish section on the Visium slide. B, UMAP dimensionality reduction of all spots based on their whole-gene expression patterns. Based on the UMAP clustering, spots were clustered into 10 clusters numbered from 0 to 9. Cluster 6 was subdivided into dorsal and ventral regions based on their location and UMAP positions (see Fig. 4). C, location of each spot color-coded by clusters in the section. The number indicates each cluster. |
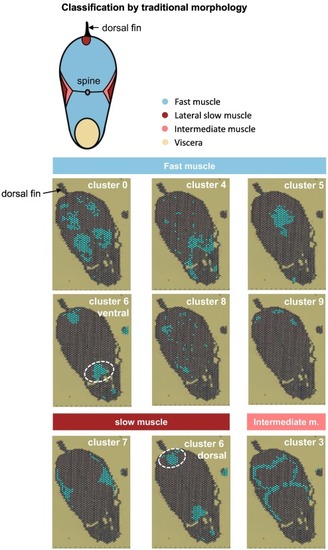
Fig. 3. Classification of each cluster by muscle type. Each cluster is classified into fast, slow, or intermediate muscle based on the traditional scheme of the standard composition of skeletal muscle of the trunk of teleosts. In each cluster, spots of the cluster are colored. |
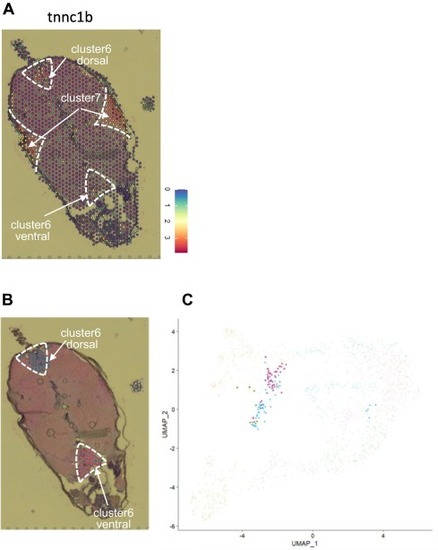
Fig. 4. Expression of tnnc1b and subdivision of cluster 6. A. the expression of tnnc1b is restricted to slow muscle. Based on the tnnc1b expression, cluster 7 and cluster 6 dorsal, but not cluster 6 ventral, represent slow muscle. Expression level is indicated with colors. The numbers in the expression color bar indicate molecular counts normalized by sctransform. B, the spots of cluster 6 were subdivided into cluster 6 dorsal (blue) and cluster 6 ventral (magenta) according to their locations. C, spots of cluster 6 dorsal (blue) and cluster 6 ventral (magenta) are indicated in the UMAP dimensionality reduction of all spots (see Fig. 2C). Positions of spots of cluster 6 were divided following their spatial positions. (For interpretation of the references to color in this figure legend, the reader is referred to the web version of this article.) |
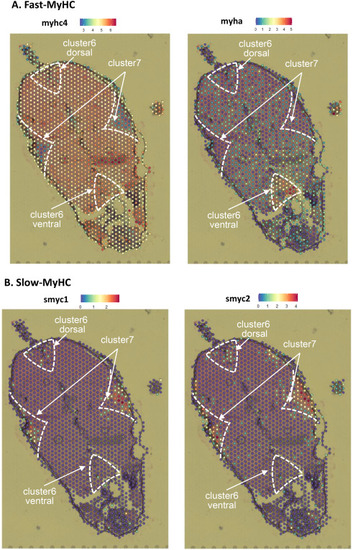
Fig. 5. Expression of MyHC genes in the adult zebrafish section. A, fast-type MyHC genes, myhc4 and myha. B, slow-type MyHC genes, smyhc1 and smyhc2. The expression level is indicated with colors. The numbers in the expression color bar indicate molecular counts normalized by sctransform. |
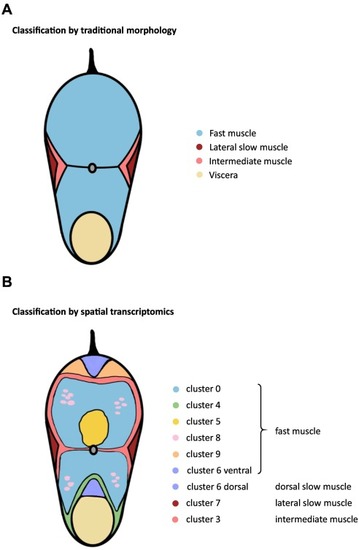
Fig. 6. Scheme of the standard composition of the skeletal muscle of the teleost trunk (A) and the scheme based on the spatial transcriptome by the present study (B). |
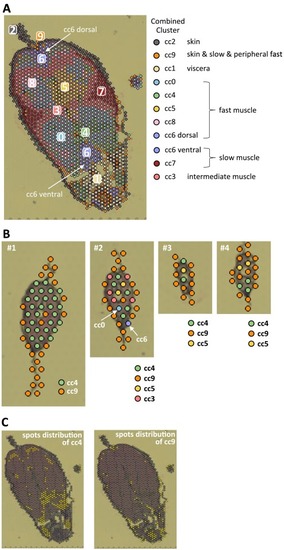
Fig. 7. Clustering of spots in the adult and larval zebrafish sections. All spots of the adult and larval sections were together subjected to clustering analysis. Ten clusters were identified and named as combined clusters (cc) 0–9. A, location of each spot color-coded by cc number in the adult section. The number indicates each cluster. B, location of each spot color-coded by cc number in the larval sections. Four specimens, numbered #1-#4, were used for the larval section. Major components of the larval sections are cc 4 and cc 9. C, distribution of spots of cc 4 and cc 9 in the adult section. |
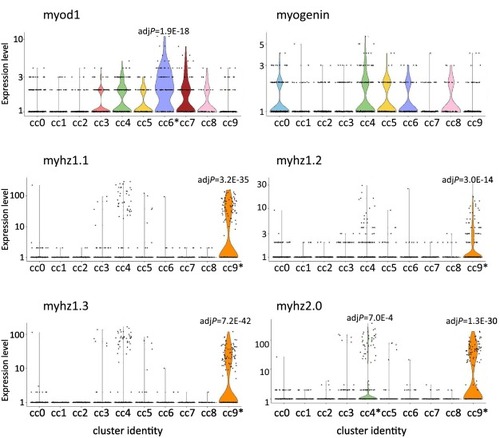
Fig. 8. Expression of the myogenesis-related genes in each combined cluster. The expression level (normalized UMI count) of myod1, myogenin, myhz1.1, myhz1.2, myhz1.3, and myhz2.0 in each combined cluster (cc) is indicated with the violin plot. An asterisk in a cc indicates that the gene is significantly upregulated in the cc (adjusted P-value is shown in the graph). |