
- Title
-
mir152 hypomethylation as a mechanism for non-syndromic cleft lip and palate
- Authors
- Alvizi, L., Brito, L.A., Kobayashi, G.S., Bischain, B., da Silva, C.B.F., Ramos, S.L.G., Wang, J., Passos-Bueno, M.R.
- Source
- Full text @ Epigenetics
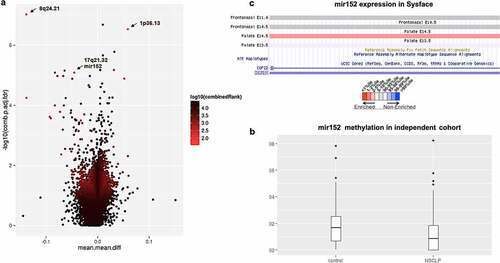
Figure 1. mir152 is differentially methylated in NSCLP cohorts. (a) Volcano plot of differentially methylated regions (DMRs) in the 450 K cohort. Light blue spots are the best ranked DMRs by a p-value, methylation difference and quotient of difference by RnBeads. Arrows indicate DMRs at 8q24.21, 1p36.13, and mir152. (b) mir152 is significantly hypomethylated in the BSAS cohort. Boxplots with central lines as medians. p-Value = 0.005 (Mann–Whitney’s test). (c) mir152 expression changes are detected in developing craniofacial structures as revealed at the database Sysface. Higher signals for mir152 expression are detected in developing murine palate (E14.5) in red and also frontonasal prominences E10.5 and E11 (grey). |
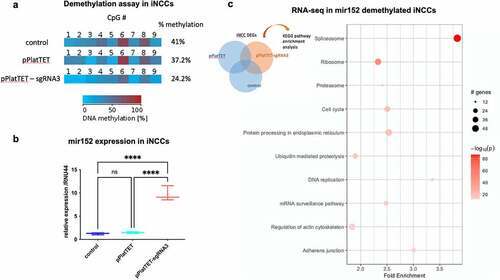
Figure 2. DNA methylation changes at mir152 DMRs results in mir152 expression changes and affects Spliceosomal, Ribosomal, and Adherens Junctions pathways. (a) A Cas9-based approach for target demethylation using the vector pPlatTET and mir152 specific single-guide RNA sequences (sgRNA3) for mir152 DMR in iNCC. sgRNA-3 efficiently reduces mir152 methylation in comparison to the empty vector transfection (pPlatTET) and non-transfected cells (control). Total percentage of methylation is represented with values at the right. (b) Targeted mir152 DNA hypomethylation by pPlatTET-sgRNA-3 (modified Cas9 coupled with the catalytic domain of TET1) induces significant mir152 overexpression in induced neural crest cells (iNCCs) revealed by RT-qPCR. Relative expression to endogenous control RNU44. Mann–Whitney’s test. (c) Enriched KEGG pathways found in RNA-seq analysis in mir152 demethylated iNCCs (pPlatTET-sgRNA3), overexpressing mir152. Higher fold enrichments are observed in Spliceosome and Adherens Junctions DEGs. |
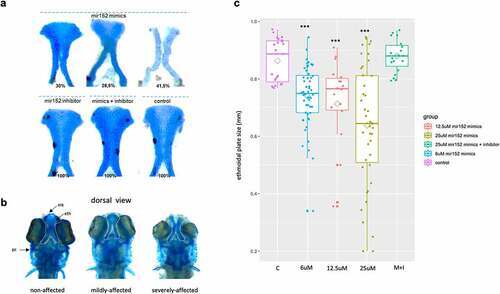
Figure 3. Mir152 mimics injected in zebrafish embryos causes ethmoidal plate defects analogue to clefts. (a) ethmoidal plates dissected from 5 dpf zebrafish larvae injected with mir152 mimics (superior) and mir152 inhibitor, mir152 mimics + inhibitor and non injected controls (inferior). mir152 mimics injections resulted in 30% of larvae with non-affected ethmoid plate (left), 28.5% of larvae with mildly affected ethmoid plate (central) and 41,5% of larvae with severe affected structures, including a cleft ethmoid plate (right). mir152 mimics injected embryos, n = 49. Both mir152 inhibitor injections and mimics + inhibitor combined injections resulted in no altered craniofacial structures with 100% of larvae with normal ethmoid plates. mir152 inhibitor injected embryos, n = 40; mimics + inhibitor injected embryos, n = 65. Control embryos, n = 107. b) Dorsal view of anterior portions of zebrafish larvae exemplifying non-affected, mildly affected, and severely affected phenotypes. White-dashed lines are positioned around the ethmoidal plates. eth: ethmoidal plate; mk: Meckel’s cartilage; pc: parachordal cartilage. c) Ethmoidal plate’s sizes in control (c) and injected conditions 6 μM, 12.5 μM, 25 μM mir152 mimics and 25 μM mir152 mimics + 25 μM mir152 inhibitor). Trapezoids indicate means. Significant differences were found in comparison to controls in 6, 12.5, and 25 μM mir152 mimics injections (p < 0.0001; ANOVA, Bonferroni). |
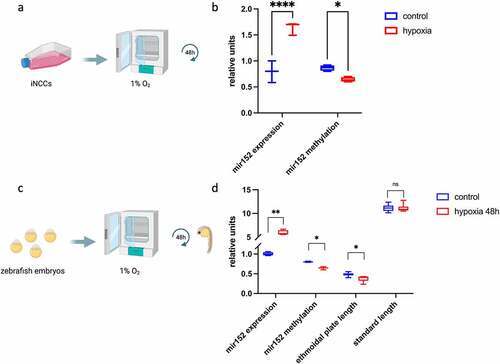
Figure 4. Hypoxia induces mir152 overexpression in human cells and zebrafish embryos and craniofacial defects in zebrafish larvae. (a) Scheme of hypoxia in induced neural crest cells (iNCCs). (b) RT-qPCR of mir152 expression in iNCCs in both control and hypoxia conditions for 48 h, showing increased expression of mir152 and reduced mir152 DNA methylation in hypoxia (p < 0.05). Units in mir152 expression values refer to relative expression normalized by RNU44; units in mir152 methylation refer to methylation indexes varying from 0 to 1. (c) Scheme of exposure to hypoxia in zebrafish embryos. (d) mir152 expression significantly increases under hypoxia for 48 h, accompanied by mir152 DNA methylation reduction and ethmoidal plate reduction. (*p < 0.05; **p < 0.005, ****p < 0.00005 Mann–Whitney’s test). Relative units at y-axis for mir152 expression refers to relative expression normalized by RNU6; units in mir152 methylation refer to methylation indexes varying from 0 to 1; units in ethmoidal plate length are in millimetres, as well as for standard length. |

ZFIN is incorporating published figure images and captions as part of an ongoing project. Figures from some publications have not yet been curated, or are not available for display because of copyright restrictions. EXPRESSION / LABELING:
|