
- Title
-
Toxicity Assessment of an Anti-Cancer Drug of p-Toluene Sulfonamide in Zebrafish Larvae Based on Cardiovascular and Locomotion Activities
- Authors
- Young, A.Y.W., Audira, G., Saputra, F., Alos, H.C., Aventurado, C.A., Lai, Y.H., Vasquez, R.D., Hsiao, C.D., Hung, C.H.
- Source
- Full text @ Biomolecules

The mortality rate of zebrafish larvae after 96 h of exposure to p-Toluene Sulfonamide (p-TSA) to determine the median lethal dose (LC50). |

Cardiac physiology parameter endpoints ((A) Stroke volume, (B) heart rate of atrium, (C) ejection fraction, (D) cardiac output, (E) heart rate of ventricle, and (F) shortening fraction) of zebrafish larvae at 72 hpf after 24 h incubation in 10, 50, and 100 ppm of p-Toluene Sulfonamide (p-TSA). The statistical difference was calculated using Ordinary One-Way ANOVA with Dunnet multiple comparison test. The data are expressed as mean with SD (n = 29; * p < 0.05). |
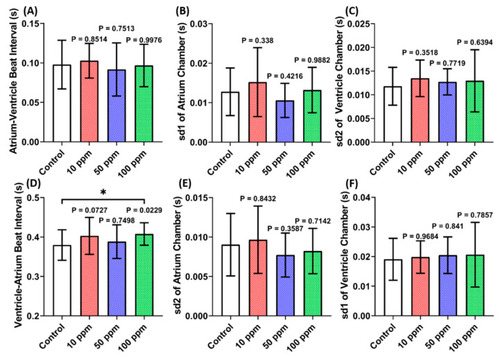
Cardiac rhythm parameter endpoints ((A) Atrium-ventricle beat interval, (B) sd1 of atrium chamber, (C) sd2 of ventricle chamber, (D) ventricle-atrium beat interval, (E) sd2 of atrium chamber, and (F) sd1 of ventricle chamber)of zebrafish larvae at 72 hpf after 24 h incubation in 10, 50, and 100 ppm of p-Toluene Sulfonamide (p-TSA). The statistical difference was calculated using Ordinary One-Way ANOVA with Dunnet multiple comparison test. The data are expressed as mean with SD (n = 29; * p < 0.05). |

Vascular performance parameter endpoints ((A) Maximum blood flow velocity and (B) average blood flow velocity) of zebrafish larvae after 24 h incubation in 10, 50, and 100 ppm of p-Toluene Sulfonamide (p-TSA). The statistical difference was calculated using Ordinary One-Way ANOVA with Dunnet multiple comparison test. The data are shown as mean with SD (n = 30, except 50 ppm group (n = 29); * p < 0.05, *** p < 0.001). |
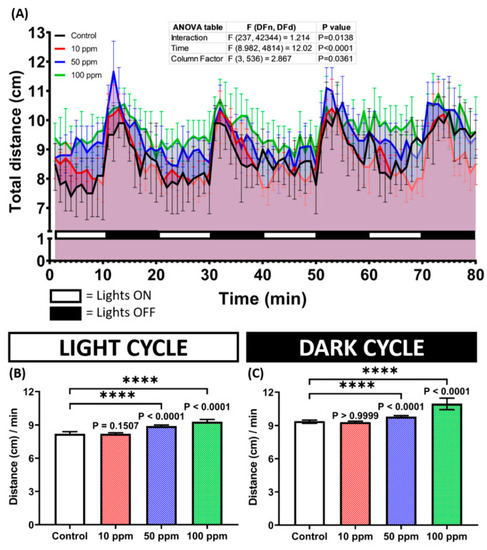
(A) Total distance traveled per minute by 128 hpf zebrafish larvae after 1-day exposure of 0 (control), 10 ppm, 50 ppm, and 100 ppm of p-Toluene Sulfonamide (p-TSA) during both light and dark cycles. The data were analyzed by a two-way ANOVA test with Geisser-Greenhouse correction, continued with Dunnett’s multiple comparisons test. (B,C) Comparison of total distance traveled by the larvae in light and dark cycles, respectively. The data were analyzed using the Kruskal–Wallis test, followed by Dunn’s multiple comparisons test. All data are expressed in median with 95% CI (n = 135 for control and 10 ppm groups, n = 134 for 50 ppm group, n = 136 for 100 ppm group; **** p < 0.0001). |

(A) Total distance traveled per second by 192 hpf zebrafish larvae after 4-day exposure of 0 (control), 10, 50, and 100 ppm of p-Toluene Sulfonamide (p-TSA) during the vibrational startle response assay. The data were analyzed using a two-way ANOVA test with Geisser-Greenhouse correction, followed by Dunnett’s multiple comparisons test. (B) A comparison of the total distance traveled by the tested zebrafish larvae during the occurrence of the tapping stimuli. The data were analyzed using the Kruskal–Wallis test, continued with Dunn’s multiple comparisons test. All data are expressed in median with 95% CI (n = 135 for control and 10 ppm groups, n = 122 for 50 ppm group, n = 90 for 100 ppm group; **** p < 0.0001). |

(A) Oxygen consumption level per minute by 96 hpf zebrafish larvae after 1-day exposure of 0 (control), 10, 50, and 100 ppm of p-Toluene Sulfonamide (p-TSA) during the respiratory rate assay. The data were analyzed using a two-way ANOVA test with Geisser-Greenhouse correction, followed by Dunnett’s multiple comparisons test. (B) Comparison of total oxygen consumption of the tested zebrafish larvae. The data were analyzed using one-way ANOVA, continued with Dunnett’s multiple comparisons test. All data expressed in the median with 95% CI (n = 69; *** p < 0.001, **** p < 0.0001). |

The expression pattern of cardiovascular development-related genes ((A) amhc, (B) myh6, (C) vegfaa, (D) vmhc, (E) gata1, (F) gata4, (G) hbbe1, (H) hbbe2, (I) hbae1, and (J) tbx5) in 5 dpf zebrafish larvae after 1 day exposure of p-Toluene Sulfonamide (p-TSA). The data were analyzed by using one-way ANOVA test, followed with Dunnett’s multiple comparisons test, and are presented as mean with SD (n = 3 groups with a total of 210 zebrafish larvae; * p < 0.05,** p < 0.01). |

Summary of the present study demonstrated various alterations that occurred in zebrafish larvae after p-Toluene Sulfonamide (p-TSA) exposure (↑: upregulated, ↓: downregulated, -: no significant change). |