
- Title
-
Design, Synthesis and Biological Investigation of 2-Anilino Triazolopyrimidines as Tubulin Polymerization Inhibitors with Anticancer Activities
- Authors
- Romagnoli, R., Oliva, P., Prencipe, F., Manfredini, S., Budassi, F., Brancale, A., Ferla, S., Hamel, E., Corallo, D., Aveic, S., Manfreda, L., Mariotto, E., Bortolozzi, R., Viola, G.
- Source
- Full text @ Pharmaceuticals (Basel)

Structures of CA-4 (1a), CA-4P (1b), tirbanibulin, general structure (2) of 1-(3′,4′,5′-trimethoxybenzoyl)-5-amino-1,2,4-triazoles and [1,2,4]triazolo[1,5-a]pyrimidines reported in this manuscript (3) and reported in the literature (4 and 5). |
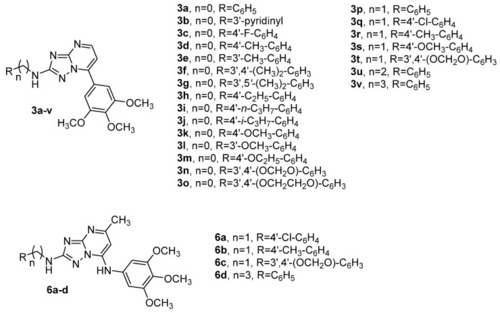
Chemical structures of newly synthesized compounds 3a–v based on the 7-(3′,4′,5′-trimethoxyphenyl)[1,2,4]triazolo[1,5-a]pyrimidine scaffold and general molecular formula 6a–d of triazolopyrimidines published by us (ref. [65]). |
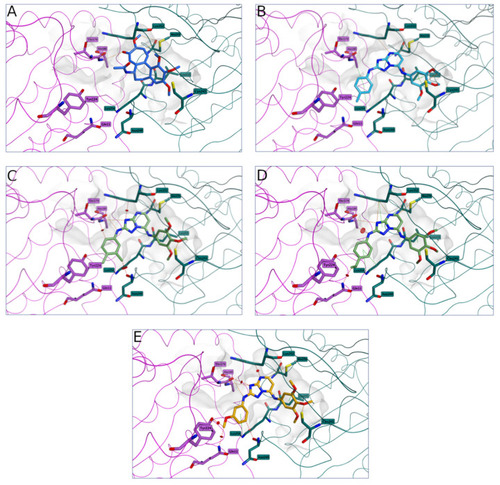
Colchicine binding conformation (A) and proposed binding for compounds 3d (B), 3f (C), 3h (D) and 3l (E) in the colchicine site. All the derivatives presented the trimethoxyphenyl ring in proximity to βCys241, while the substituted phenyl group at position 2 of the central core was sited at the interface between the two tubulin subunits, pointing toward a loop in the α-subunit (αSer178-αThr179). Compound 3d presented two main interactions with βCys241, different anchoring contacts with the surrounding residues and no clashes with the tubulin structure. The rest of the compounds, even if conserving different interactions, including the important interaction with βCys241, presented different clashes with the surrounding residues, suggesting a non-optimal occupation of the colchicine site and indicating a reduced affinity for tubulin. The carbon atoms of the tubulin α unit residues are shown in lilac, while the carbon atoms of the β unit residues are represented in teal. Hydrogen bonds are shown as orange dashed lines, hydrophobic interactions as green dashed lines and distance clashes as red dashed lines. |

(Panel (A)) Quantitative analysis of cell cycle phase distribution in HeLa cells after a 24 h treatment with 3d, at the concentrations of 10, 25 or 50 nM. Cells were stained with PI to analyze the DNA content by flow cytometry. Data are presented as means of three independent experiments ± SEM. (Panel (B)) Effects of compound 3d on cell cycle regulatory proteins and DNA damage checkpoint proteins. HeLa cells were treated for 24 h with the indicated concentration of 3d, and expression of ATR, cdc2 (Y15) and cyclin B was detected by Western blot analysis. |
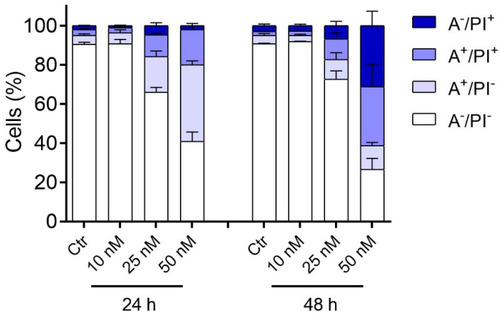
Apoptotic effects caused by 3d. HeLa cells were treated with the indicated concentrations of 3d for either 24 or 48 h and then were analyzed by flow cytometry after double staining with annexin-V-FITC and PI. A−/PI− Alive cells; A+/PI− Early apoptotic cells; A+/PI+ Late apoptotic cells; A−/PI+ Necrotic cells. In the histograms, data are represented as mean ± SEM of three independent experiments. |

Assessment of mitochondrial depolarization after treatment with 3d. HeLa cells were treated with the indicated concentrations of compound for 24 or 48 h. Data are represented as mean ± SEM of three independent experiments (** p < 0.01, *** p < 0.001). |
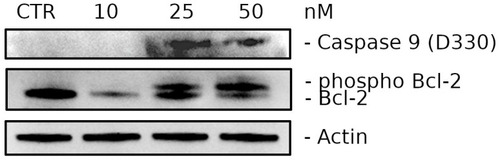
Western blot analysis of Caspase-9 (D330) (Cleaved form) and Bcl-2 levels. HeLa cells were treated for 24 h with 3d at the indicated concentrations. |

Effects of 3d treatment on the zebrafish xenotransplantation model (A). Compound 3d did not induce abnormal phenotypes or developmental anomalies in zebrafish embryos after 24, 48 and 72 h of incubation. DMSO-treated embryos were used as control. (B) Representative images of Tg(fli1:EGFP) zebrafish embryos (blood vessels shown in white) transplanted with DiI + HeLa cells (red). The embryos were treated with the indicated concentrations of 3d for 24 h and then the fluorescence intensity was quantified as depicted in panel (C). Data are expressed as mean ± SD (**** p < 0.001). Scale bar, 200 μm. Effects of 3d treatment on zebrafish embryos. No abnormal phenotypes or developmental defects were seen in comparison to DMSO-treated embryos (as a normal control) after 24, 48 and 72 h. (B) Effects of 3d treatment on the zebrafish xenotransplantation model. Representative images of Tg(fli1:EGFP) zebrafish embryos (blood vessels shown in white) transplanted with DiI + HeLa cells (red). Embryos were treated for 24 h with DMSO (control group), 30 nM 3d or 300 nM 3d. (C) Histograms represent the fluorescence intensity of the tumor xenografts, indicating total HeLa cells present in each embryo after a 24 h treatment with 3d at the indicated concentrations. Data are expressed as mean ± SD (**** p < 0.001). Scale bar, 200 μm. |